Since on many days I happily exchange my laptop keyboard for a chalkbag and some rock, one of the first ideas for the blog was to have an eye but for climbing data. Climbing, of course, isn’t mainly about crunching numbers; it is a great opportunity to exercise and spend time with friends outdoors, or to compete if you want.
But, turns out climbers have online logbooks! As I dived into the world of climbing databases I wondered: Where do people like to climb? How long do climbers take to reach a certain grade? Can we predict the hardest grade based on a climber’s physique? If you are not so familiar with the lingo of carabiners and cruxes, you can check out this paragraph.
What is in the database?
This post draws insights from the 8a.nu database, established 1999 by Jens Larssen in Sweden. The plaform allows members to record their climbing acomplishments while providing valuable information on crags and the latest climbing news. It’s worth noting that the dataset utilized in this post is downloaded from Kaggle, as 8a.nu does not provide the set, and the version employed here extends only until mid-2017.
One think to keep in mind - the dataset is likey not a random sample of climbers. Maybe climbers that track their climbs are more motivated than the average? Or younger? We don’t know, but don’t worry, there are enough interesting things to discover. 😌
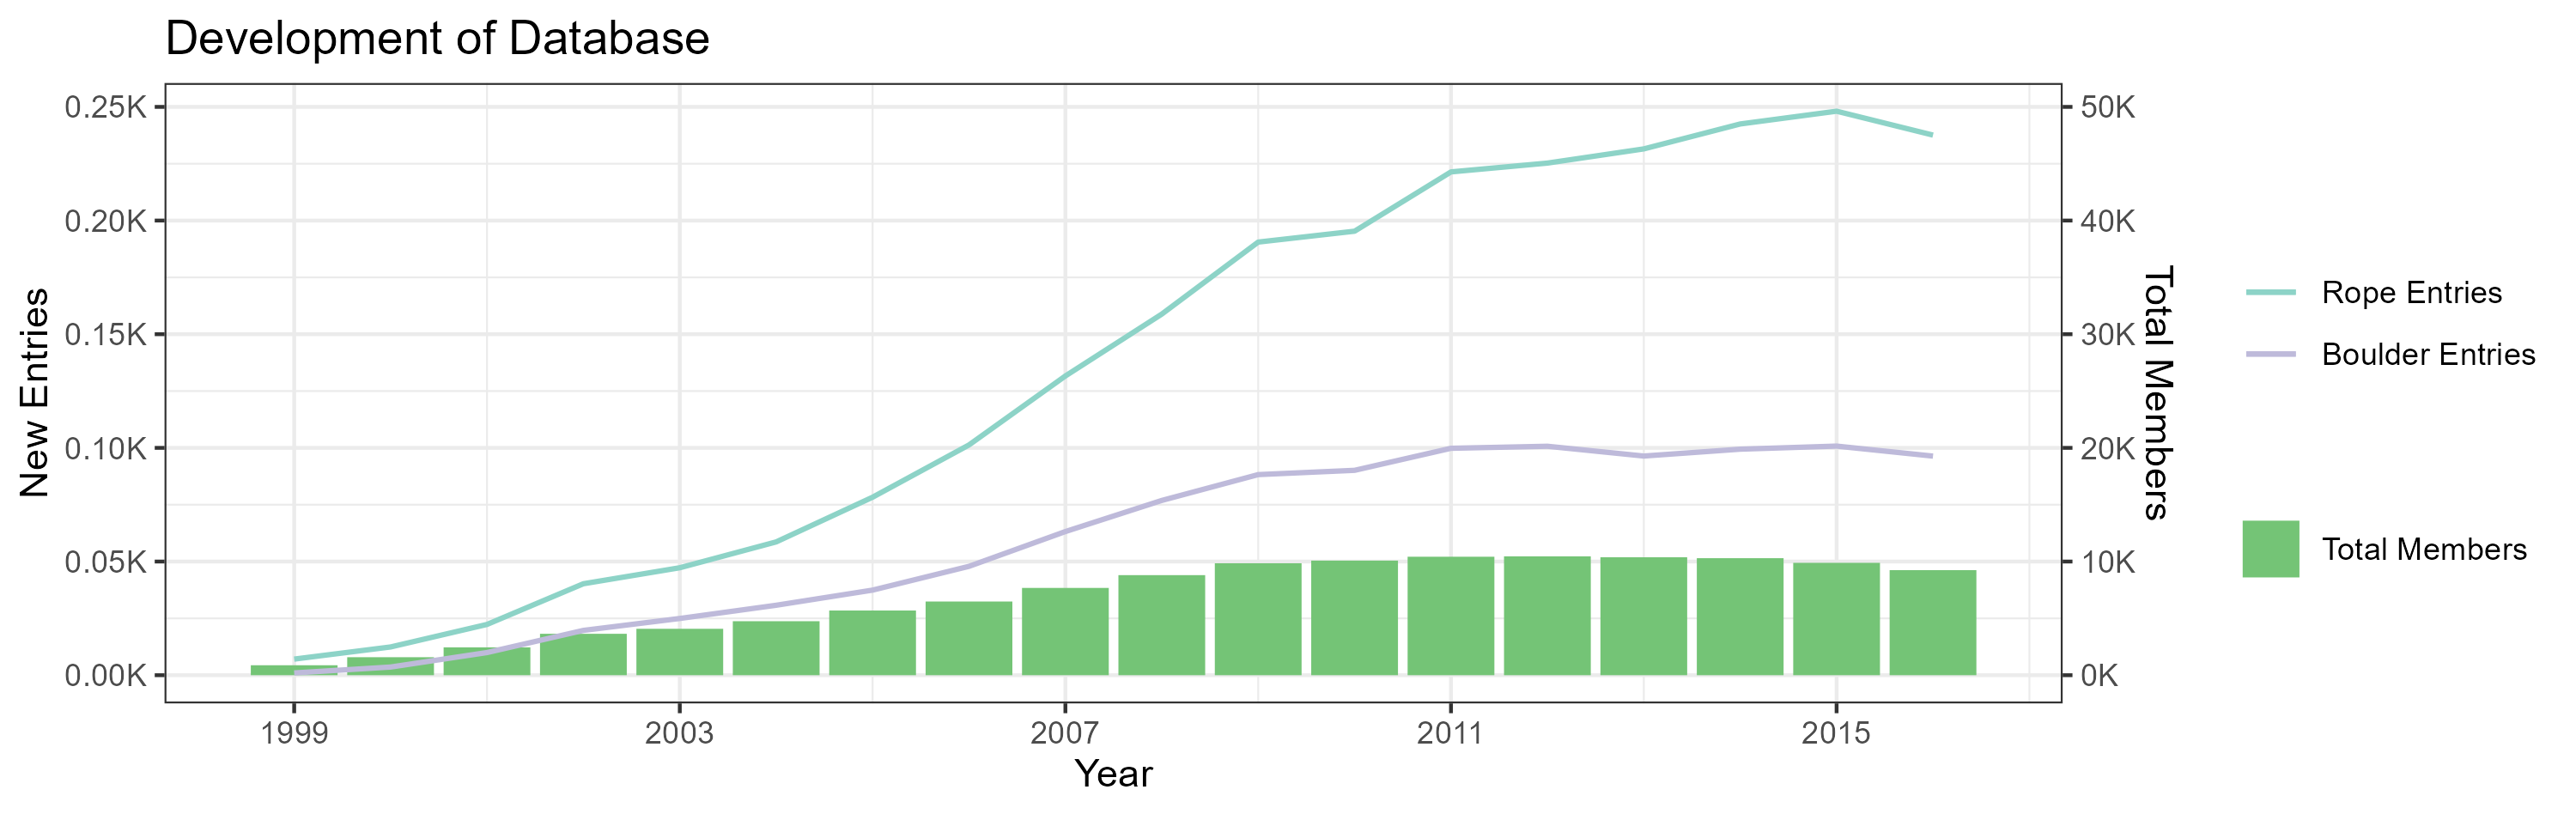
Since it’s inception, 8a.nu has grown in both members and logged climbs, with growth slowing down in the recent years. In 2017, the databases counted 7,717 members.
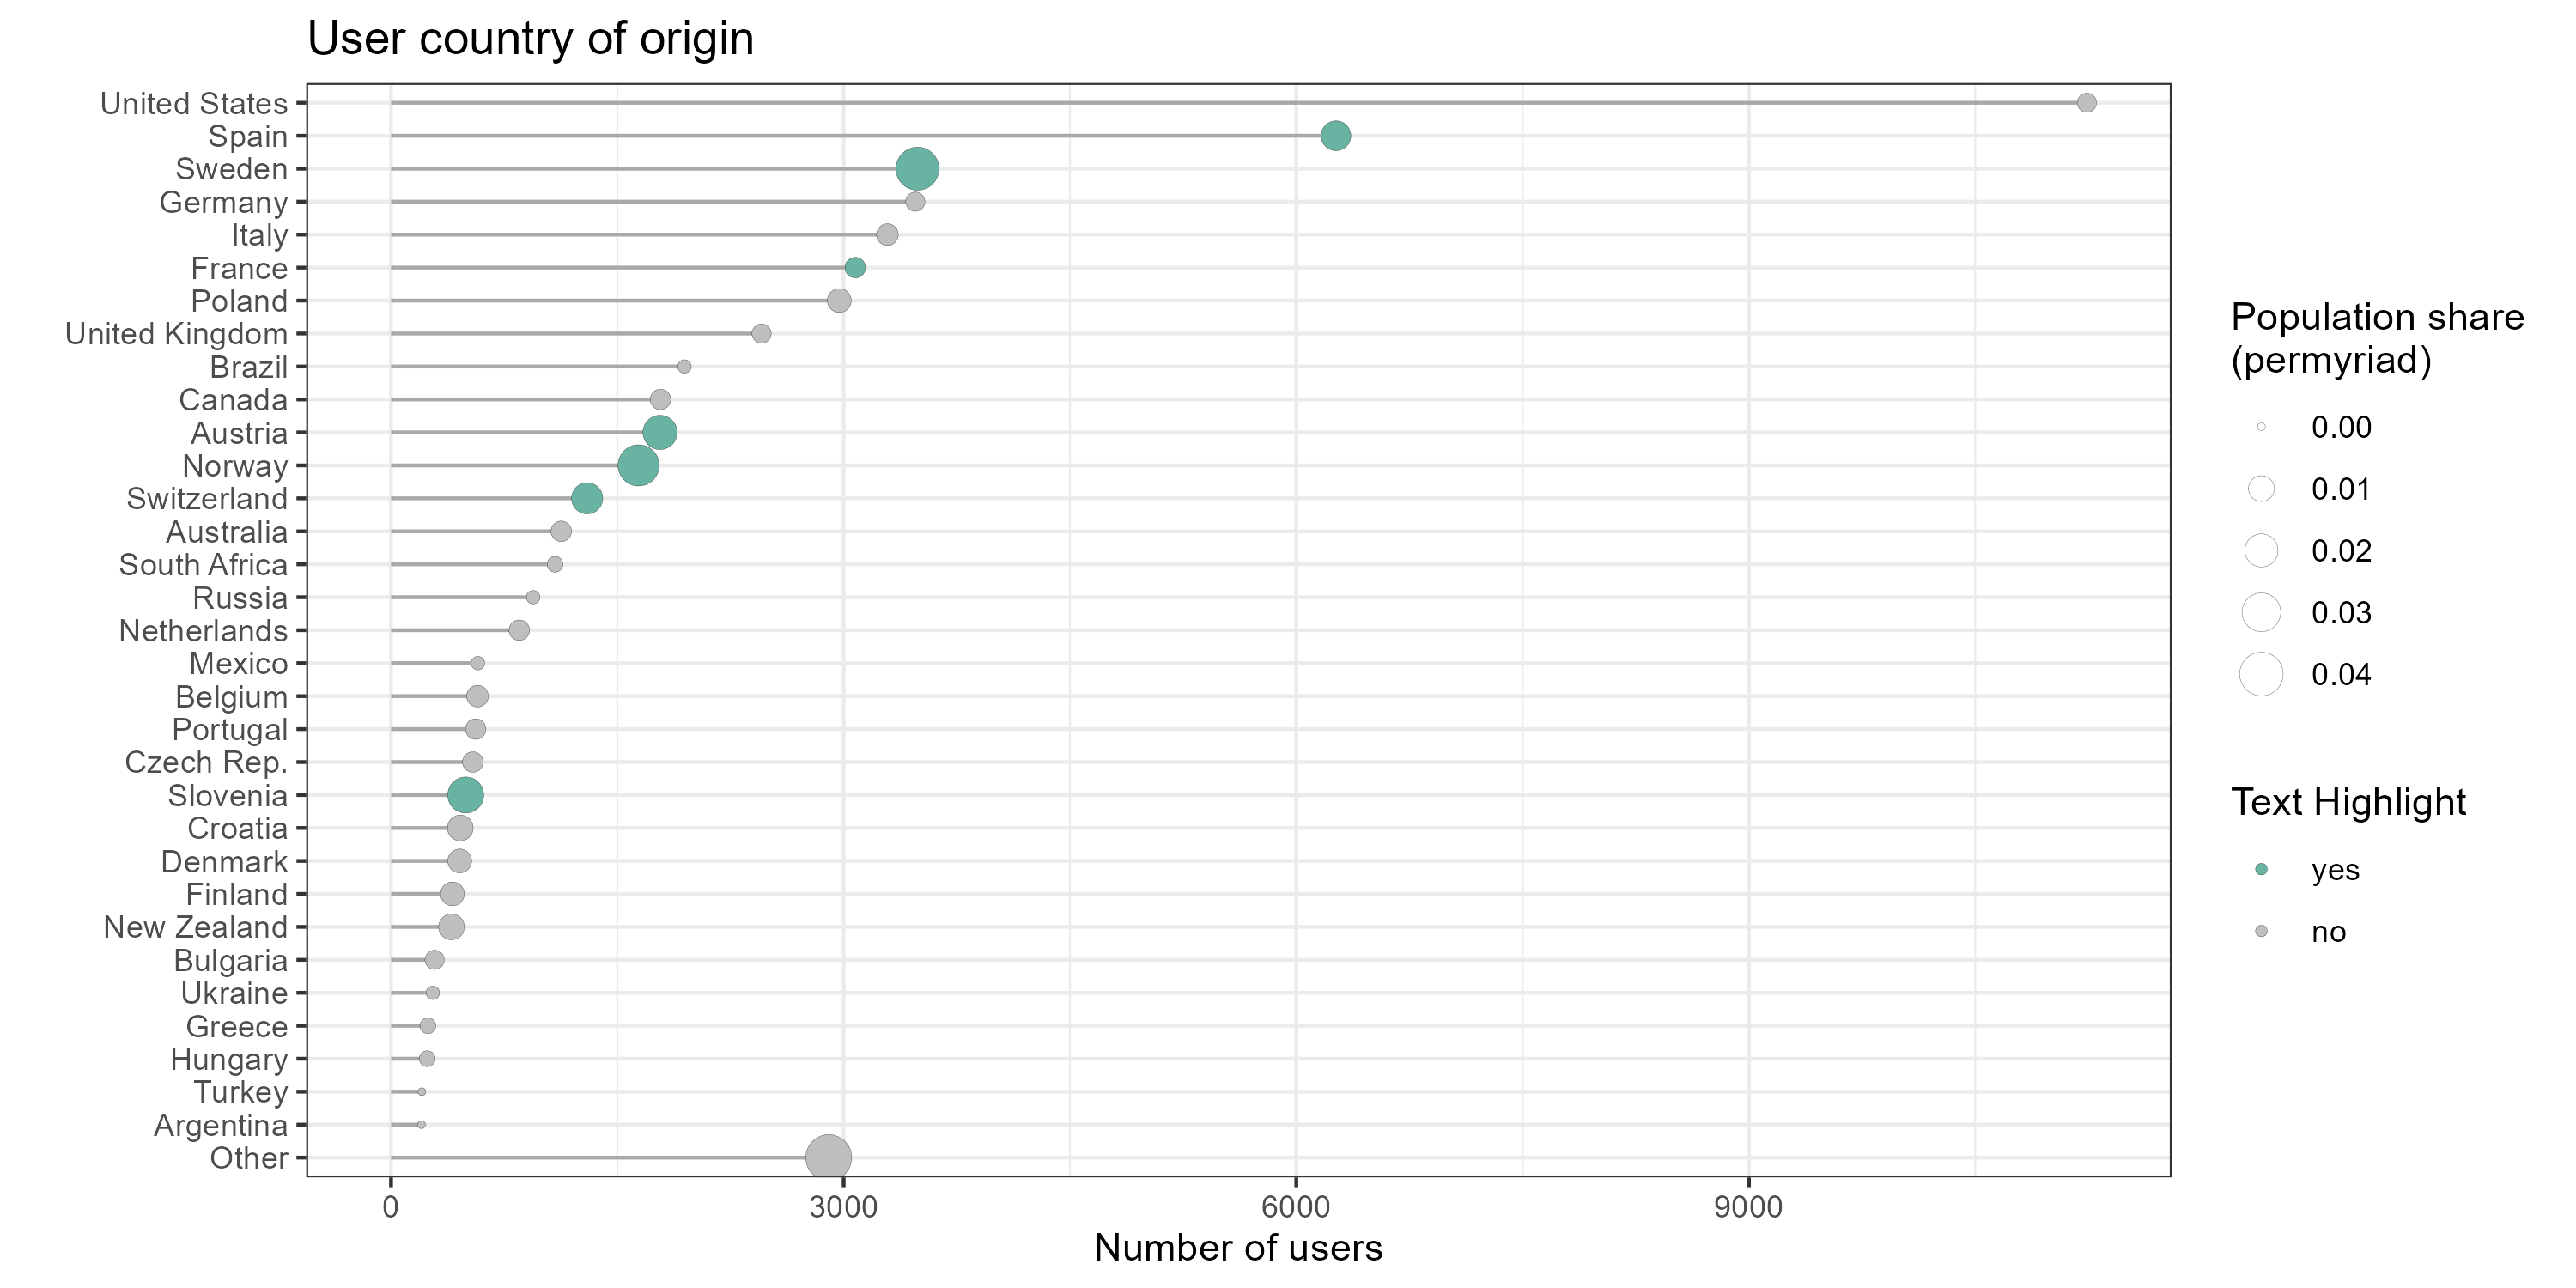
The United States and Spain emerge as the top climbing destinations for 8a.nu members. In Europe, besides Spain, France and Italy stand out as the most frequently visited locations.

As for climbing hot spots, most users country of origin are the US and Spain, followed by Sweden, Germany, and Italy. However, for members relative to population size, Norway and Sweden have a higher member share than the US and Spain (maybe not surprising giving the logbooks origins in Sweden). Also, we might slightly be able to trace the Alps in membership percentages, looking at Spain, Switzerland, Austria and Slovenia. Though what about France?[1]
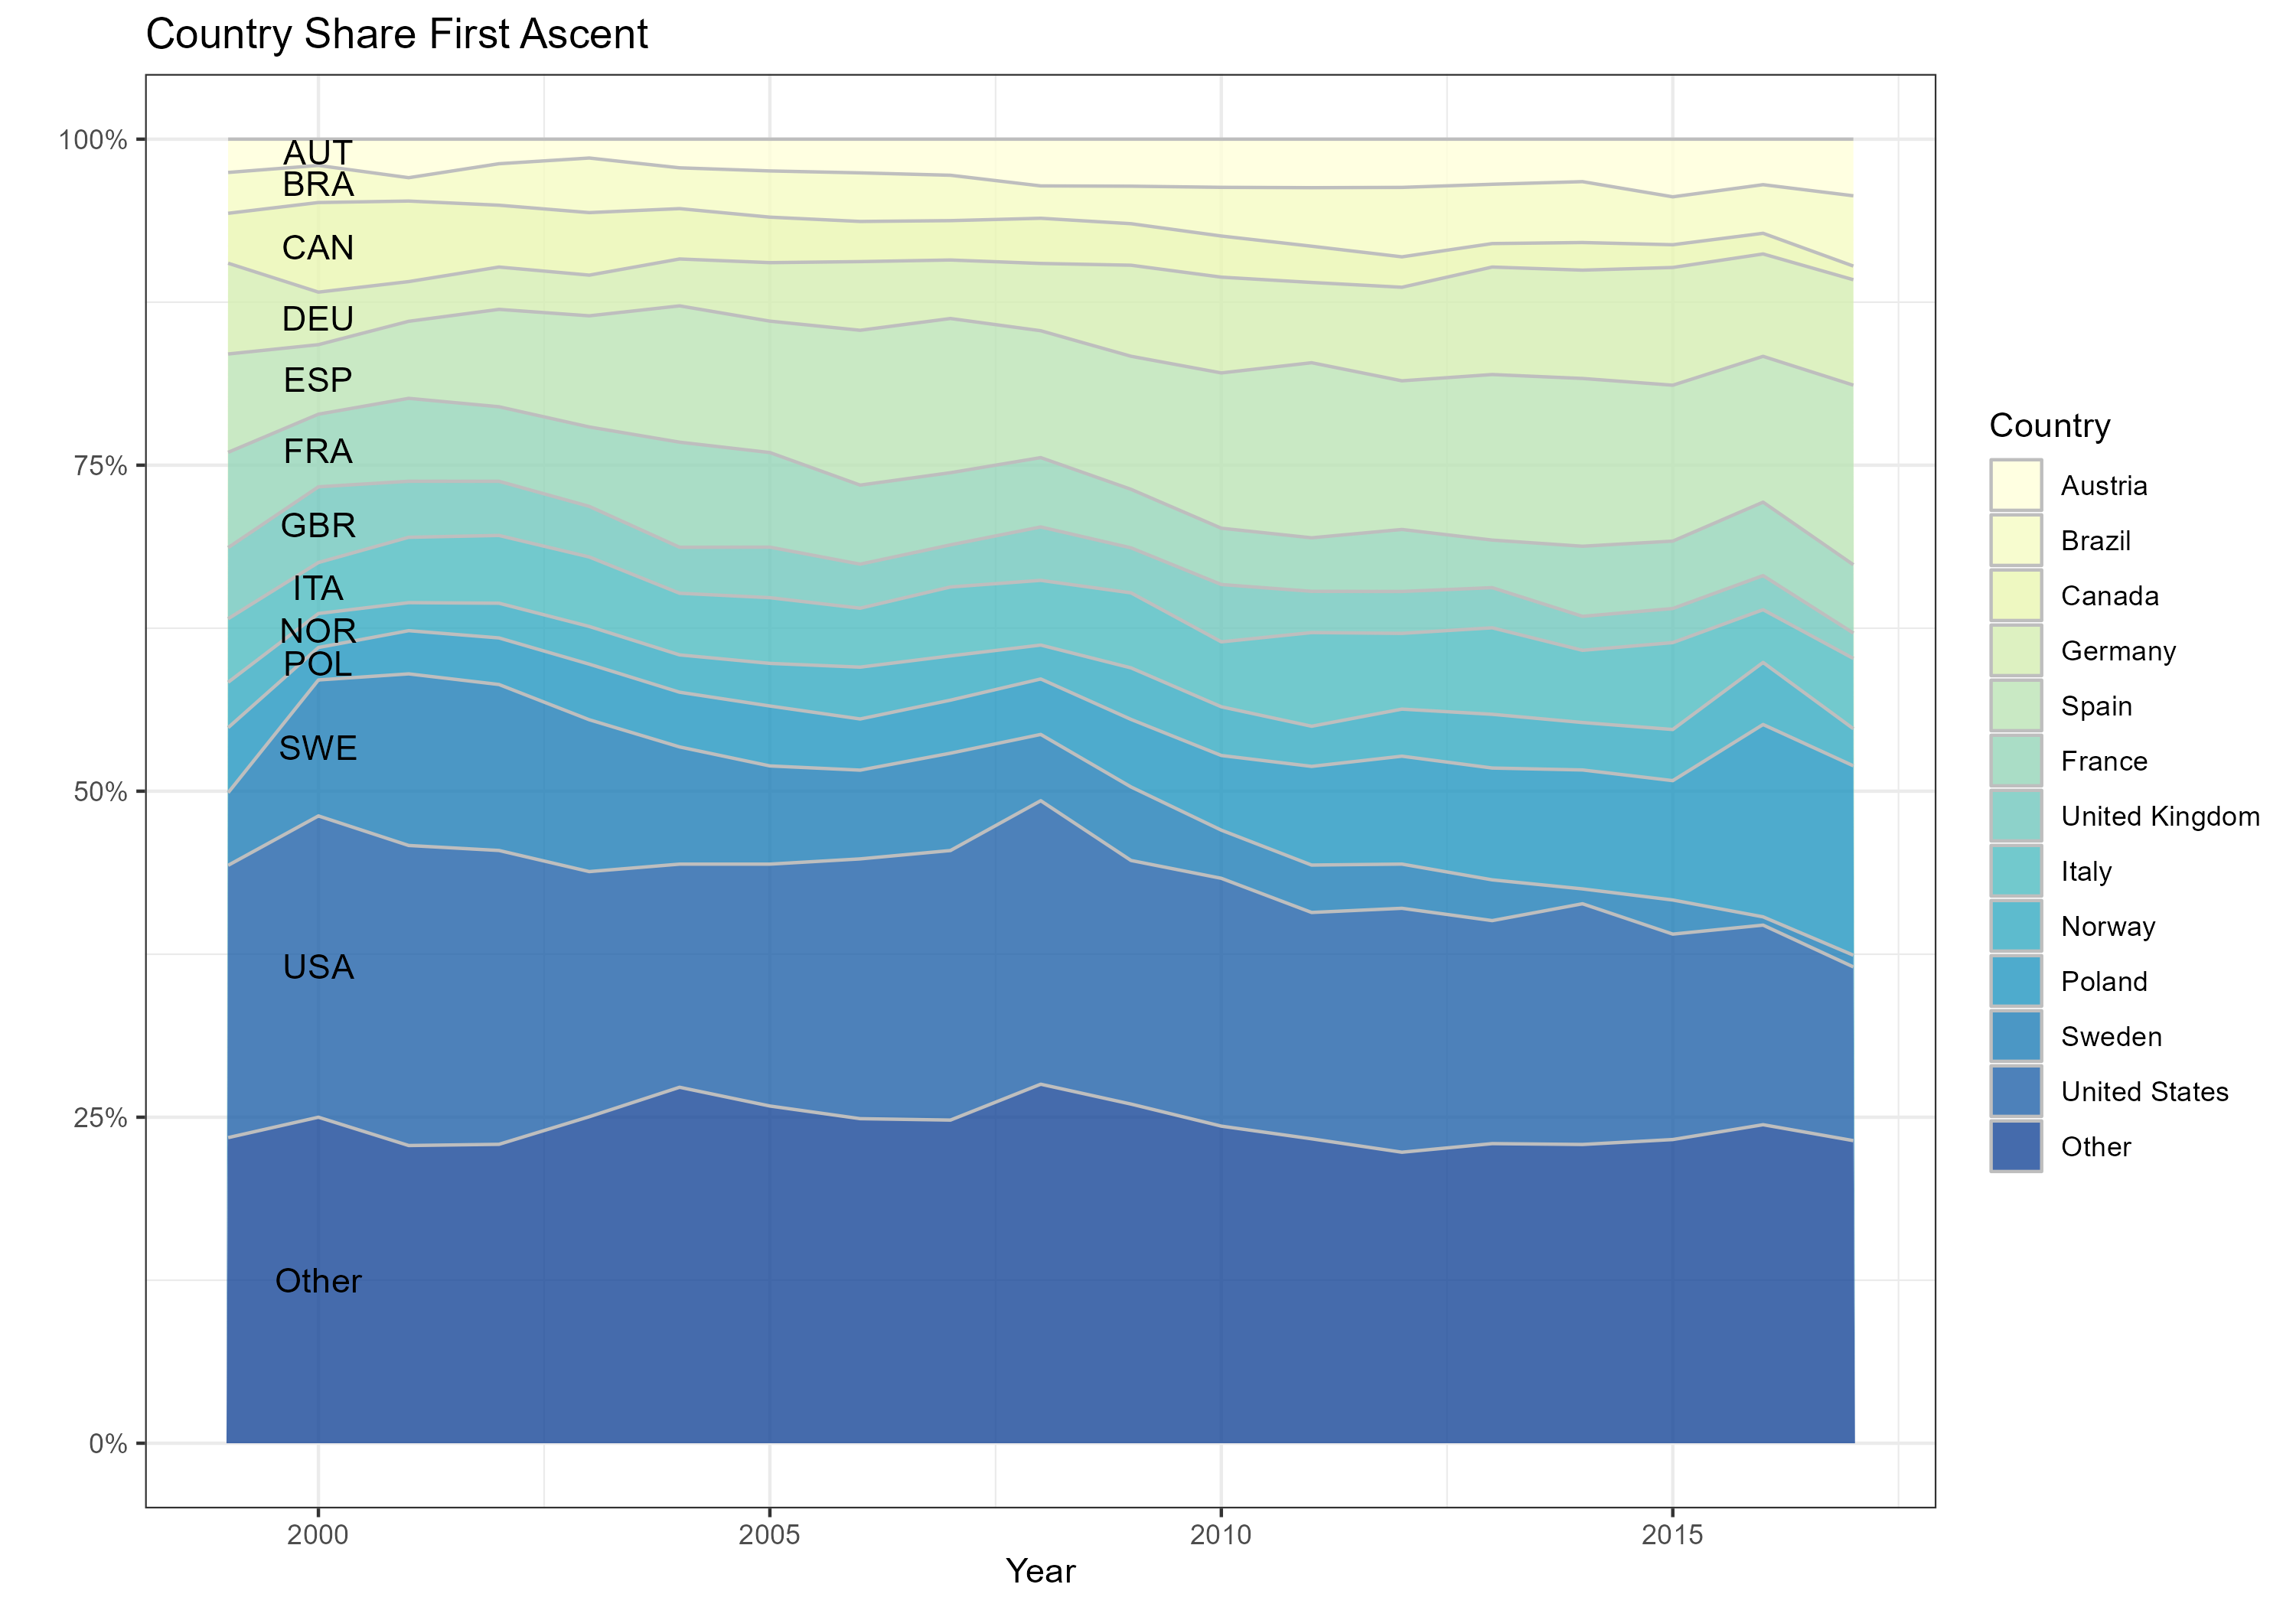
Compared to the previous graph, we now want to know how the origin of new members changes over time. While at 8a.nu’s origin it quickly gained popularity in Sweden, few new members originated from Sweden in recent years. On the contrary, 8a.nu gained popularity in Poland, Spain, and Germany.
The Climbers Demographics
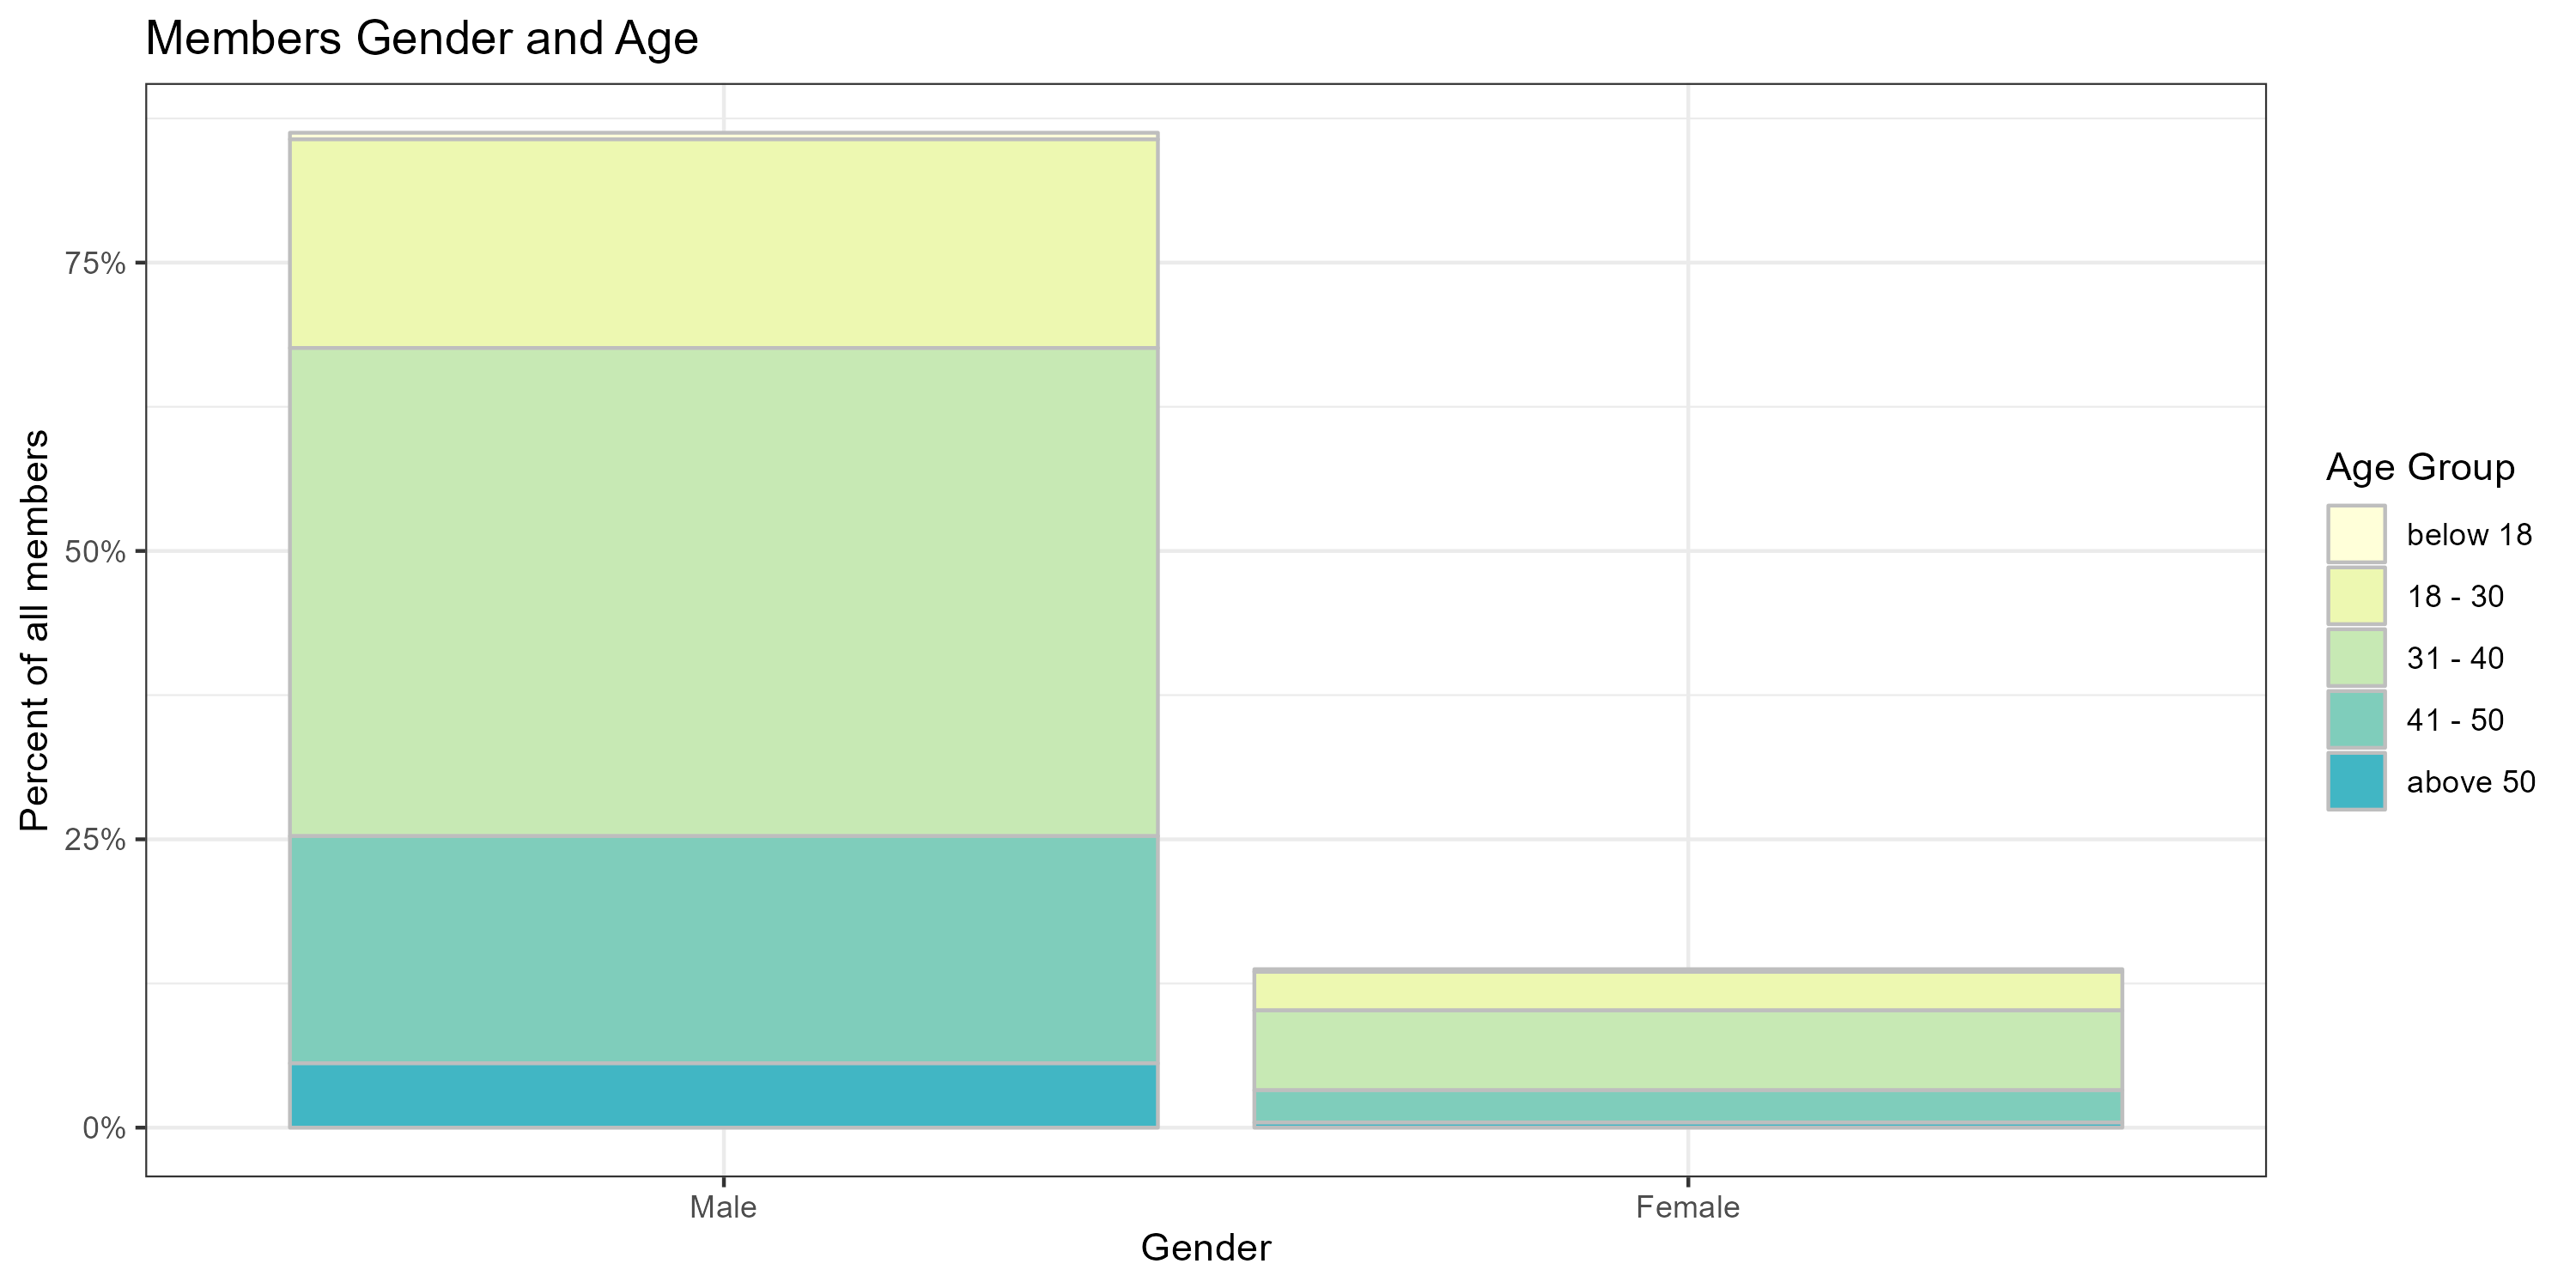
The largest user group are men between 30-40 years…
Most 8a.nu climbers are men, with 86.38% of members being men, and 13.62% women, so far other genders can’t be reported. It is hard to put numbers on the gender distribution across the whole climbing community - According to a 2020 statista survey[2], the male-female ratio in climbing is approximatelly 75% to 25%, or 60% to 40% after a 2019 estimate[3] by professional climber Sasha DiGiulian. Assuming the ratio of men to women climbing is truly 75% suggests that men climbers are more likely than women to log their climbs on 8a.nu.[4]
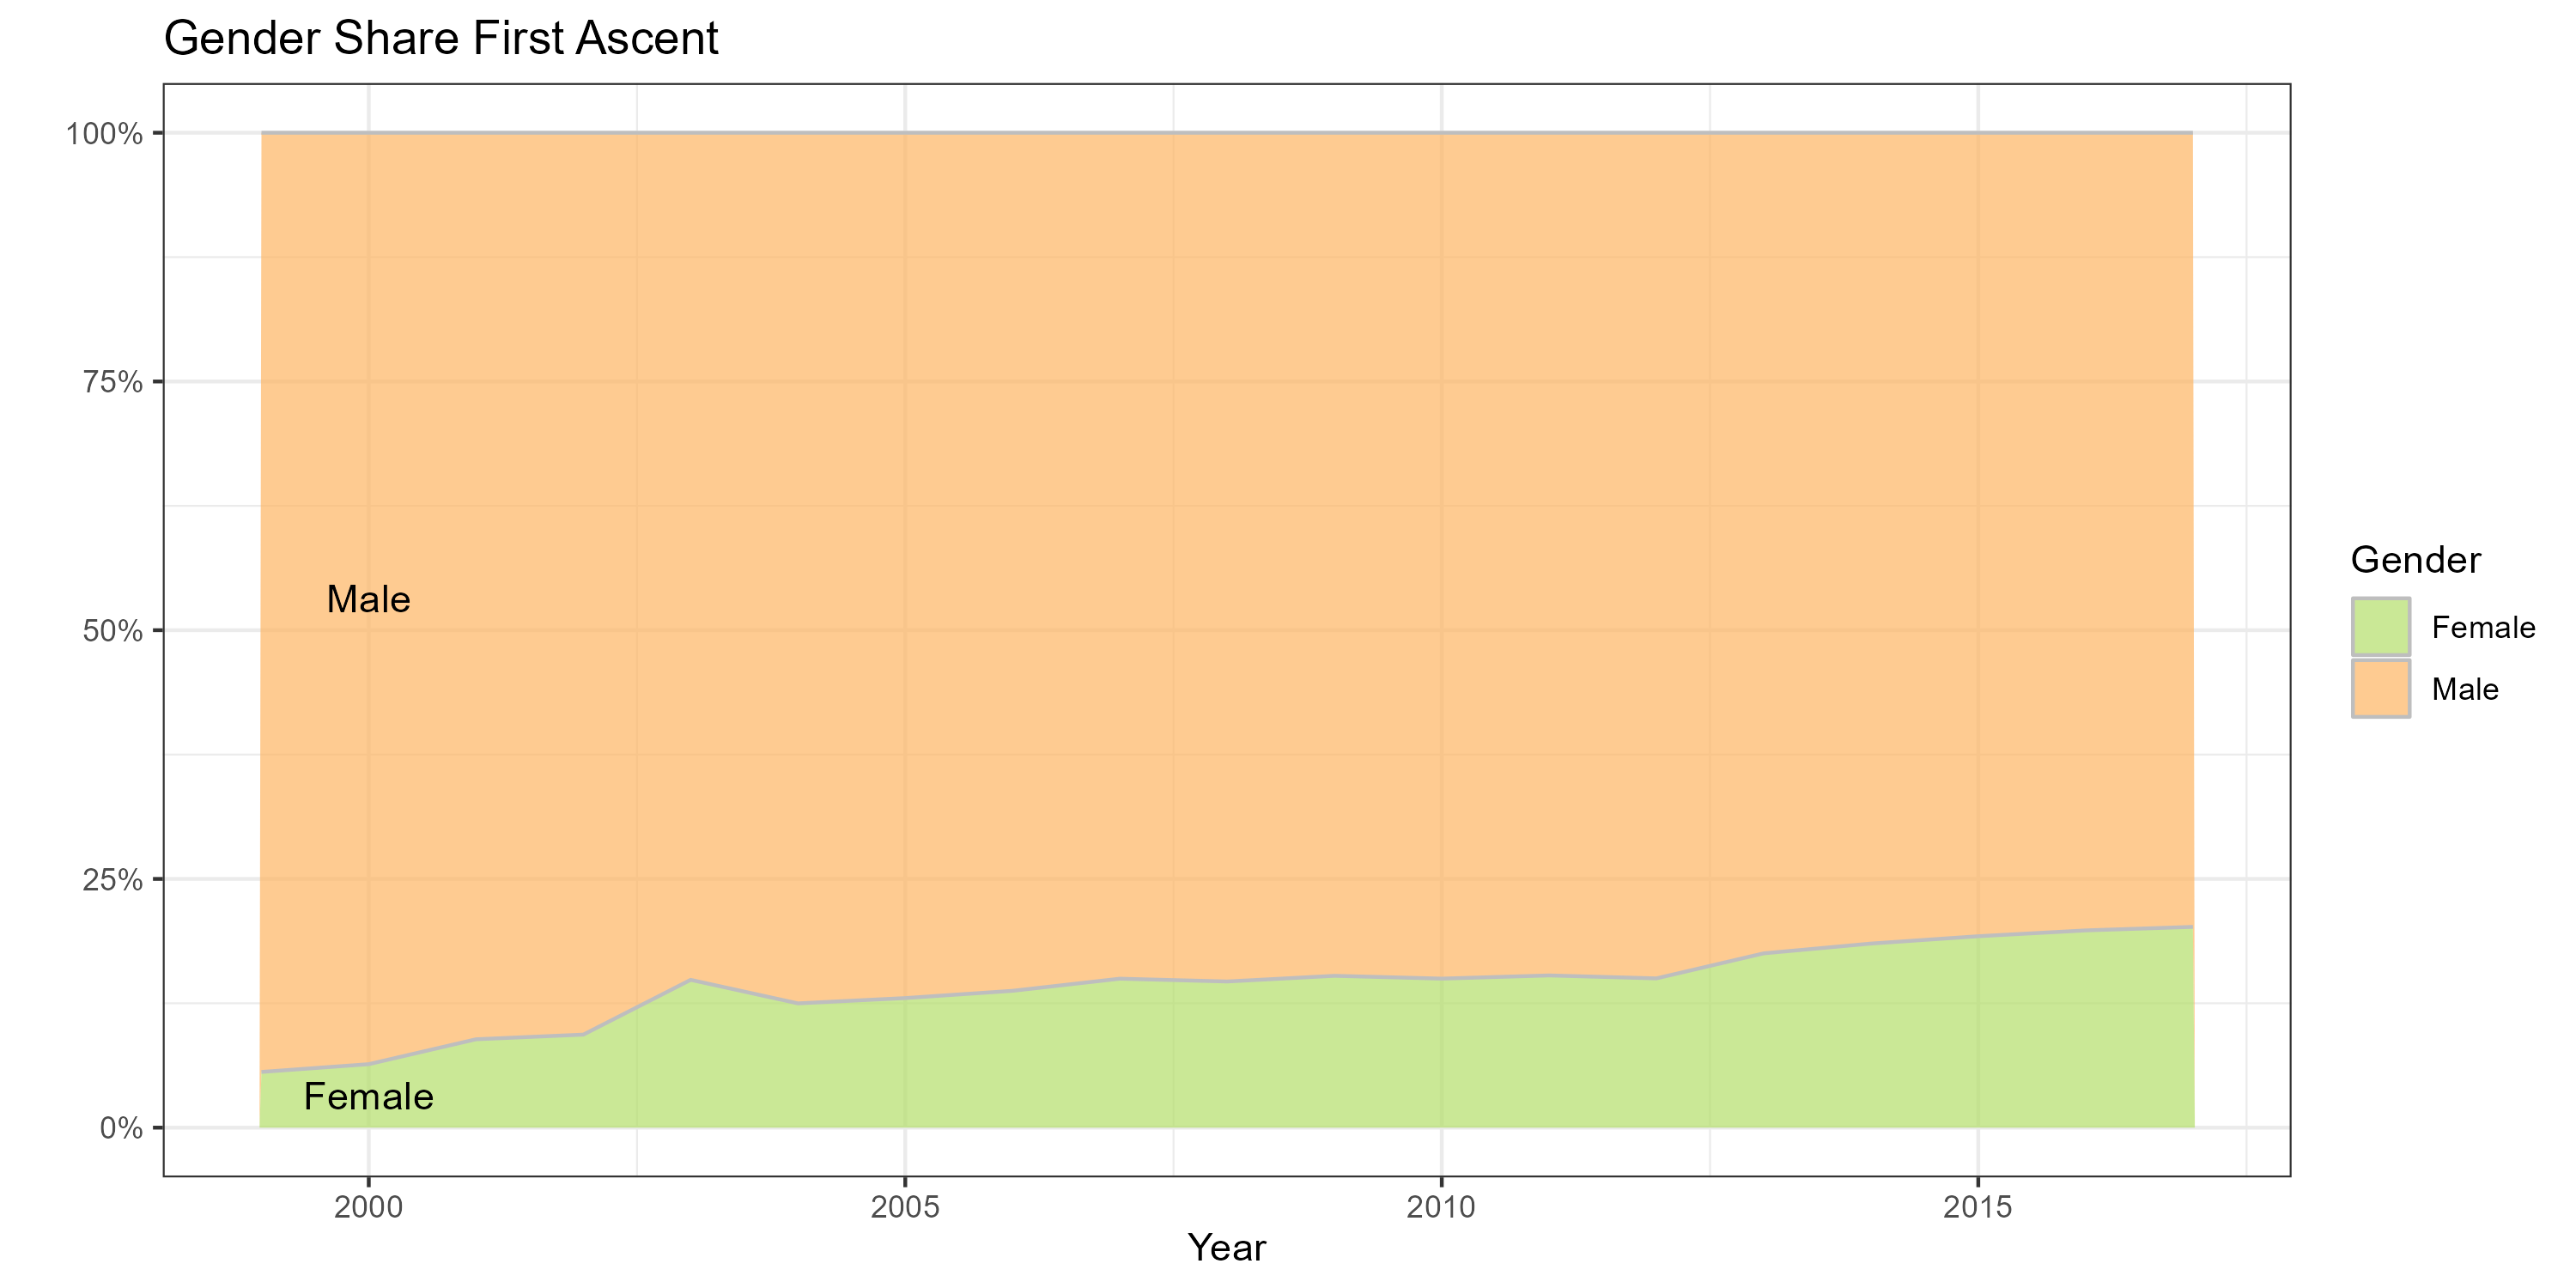
…but the share of female climbers is growing
In recent years the share of new 8a.nu members identifying as female has risen, approaching a quarter in 2016. Also, though most 8a.nu climbers are between 30 and 40 years, the most active period for logging climbs are the late twenties.
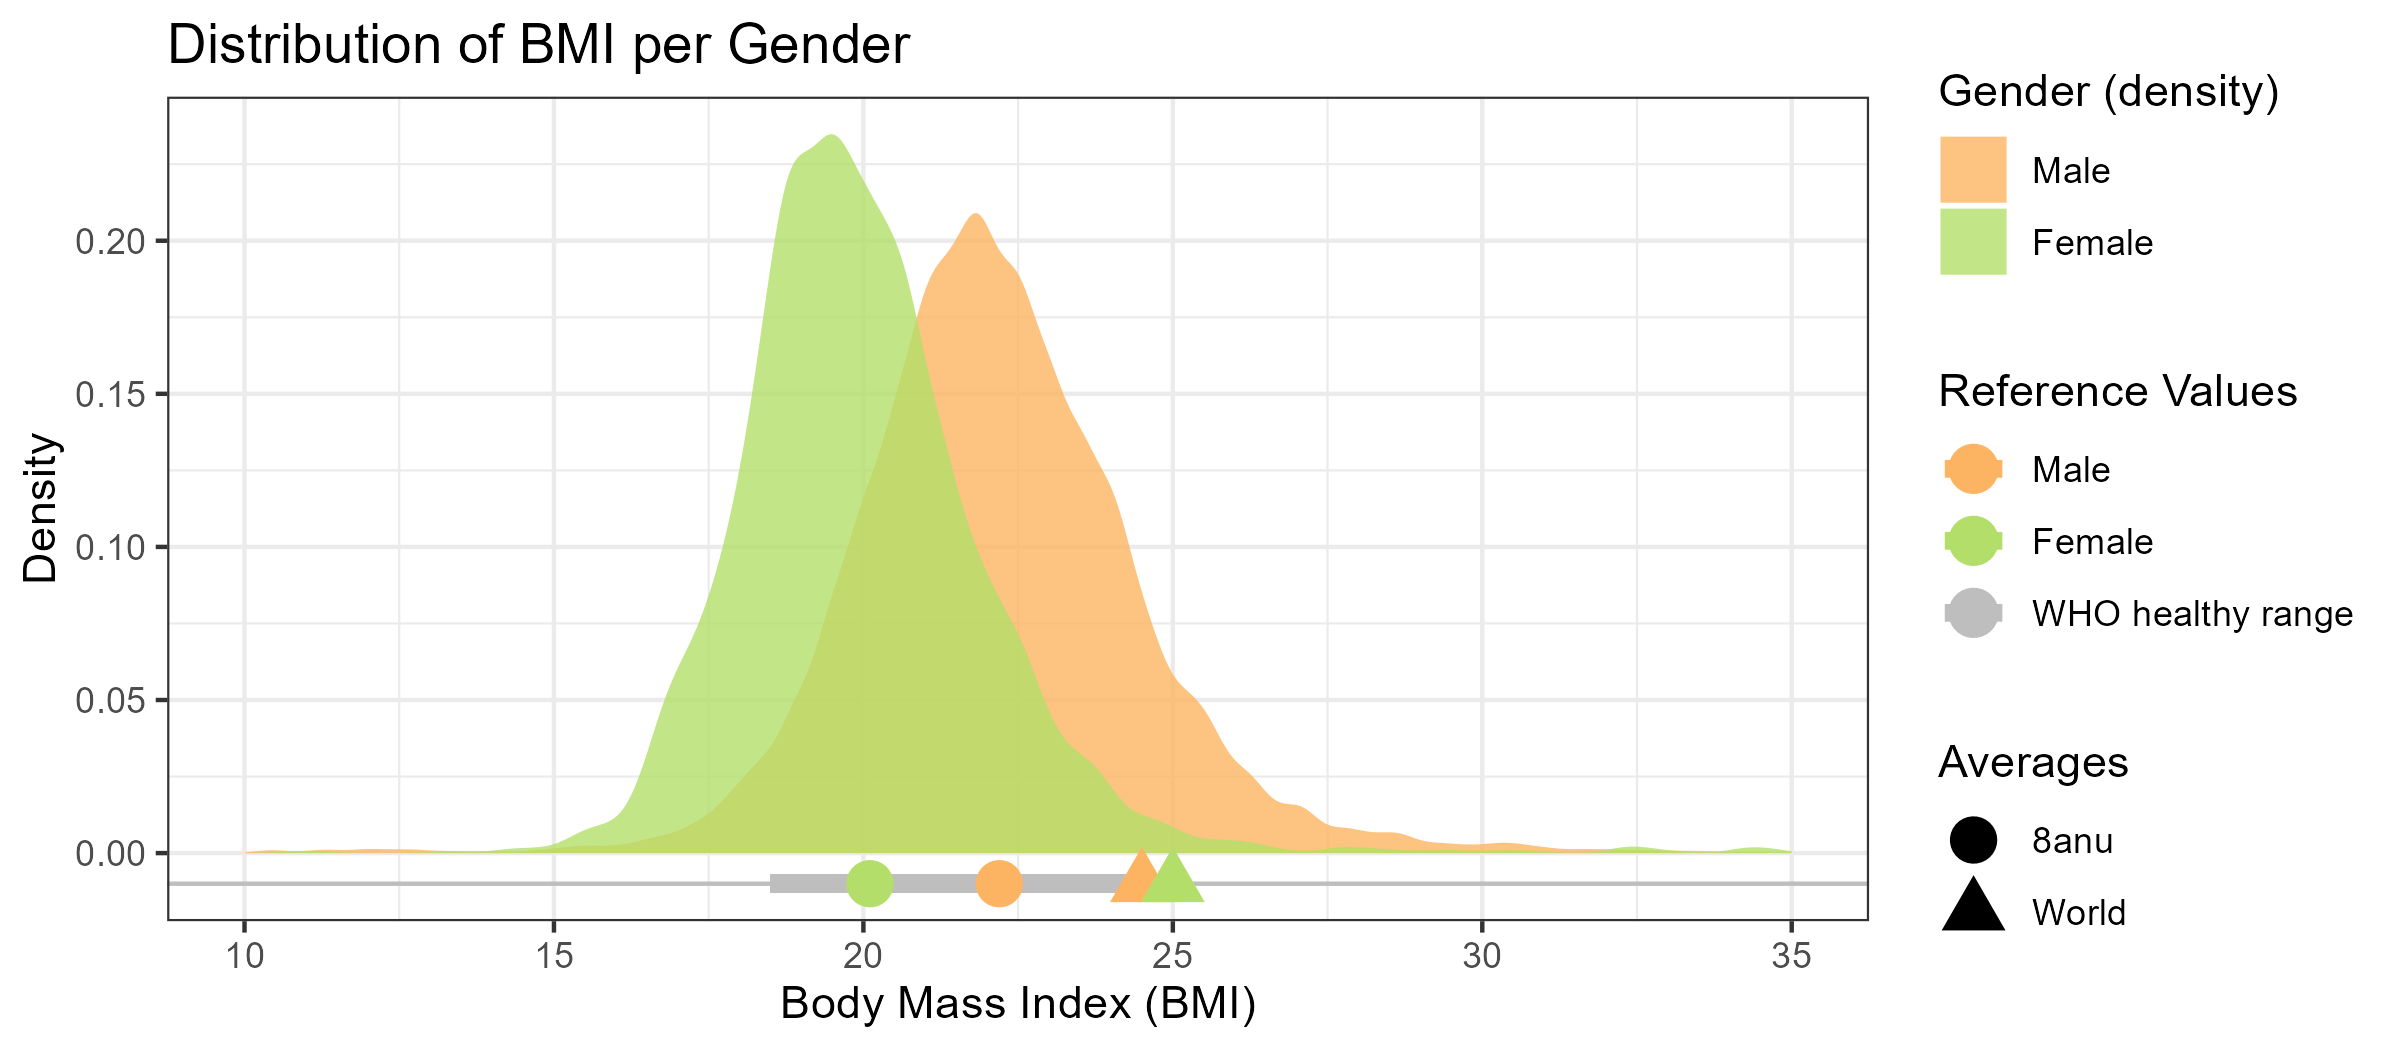
Climbers mean BMI is further away from obesity than the worldwide average
In climbing it might matter how tall (you might be able to reach higher) and heavy (you have to take every gramm up the wall) you are. On average, men are 178cm tall, whereas women measure 165cm on average. The respective means of Body Mass Index (BMI) are 22.2 and 20.11. The BMI is a simple weight-for-height index and commonly used to classify underweight, overweight and obesity. Given that the worldwide BMI averages are 24.5 (men) and 25 (women)[5], the climbers mean BMIs are significantly lower[6] than the average persons BMI. According to the World Health Organization, a healthy adult BMI ranges from 18.5-24.9.[7] While this indicates that many logbook members and in particularly women have a self-reported weight in the underweight area, this also places the worldwide BMI averages on the line of obesity.
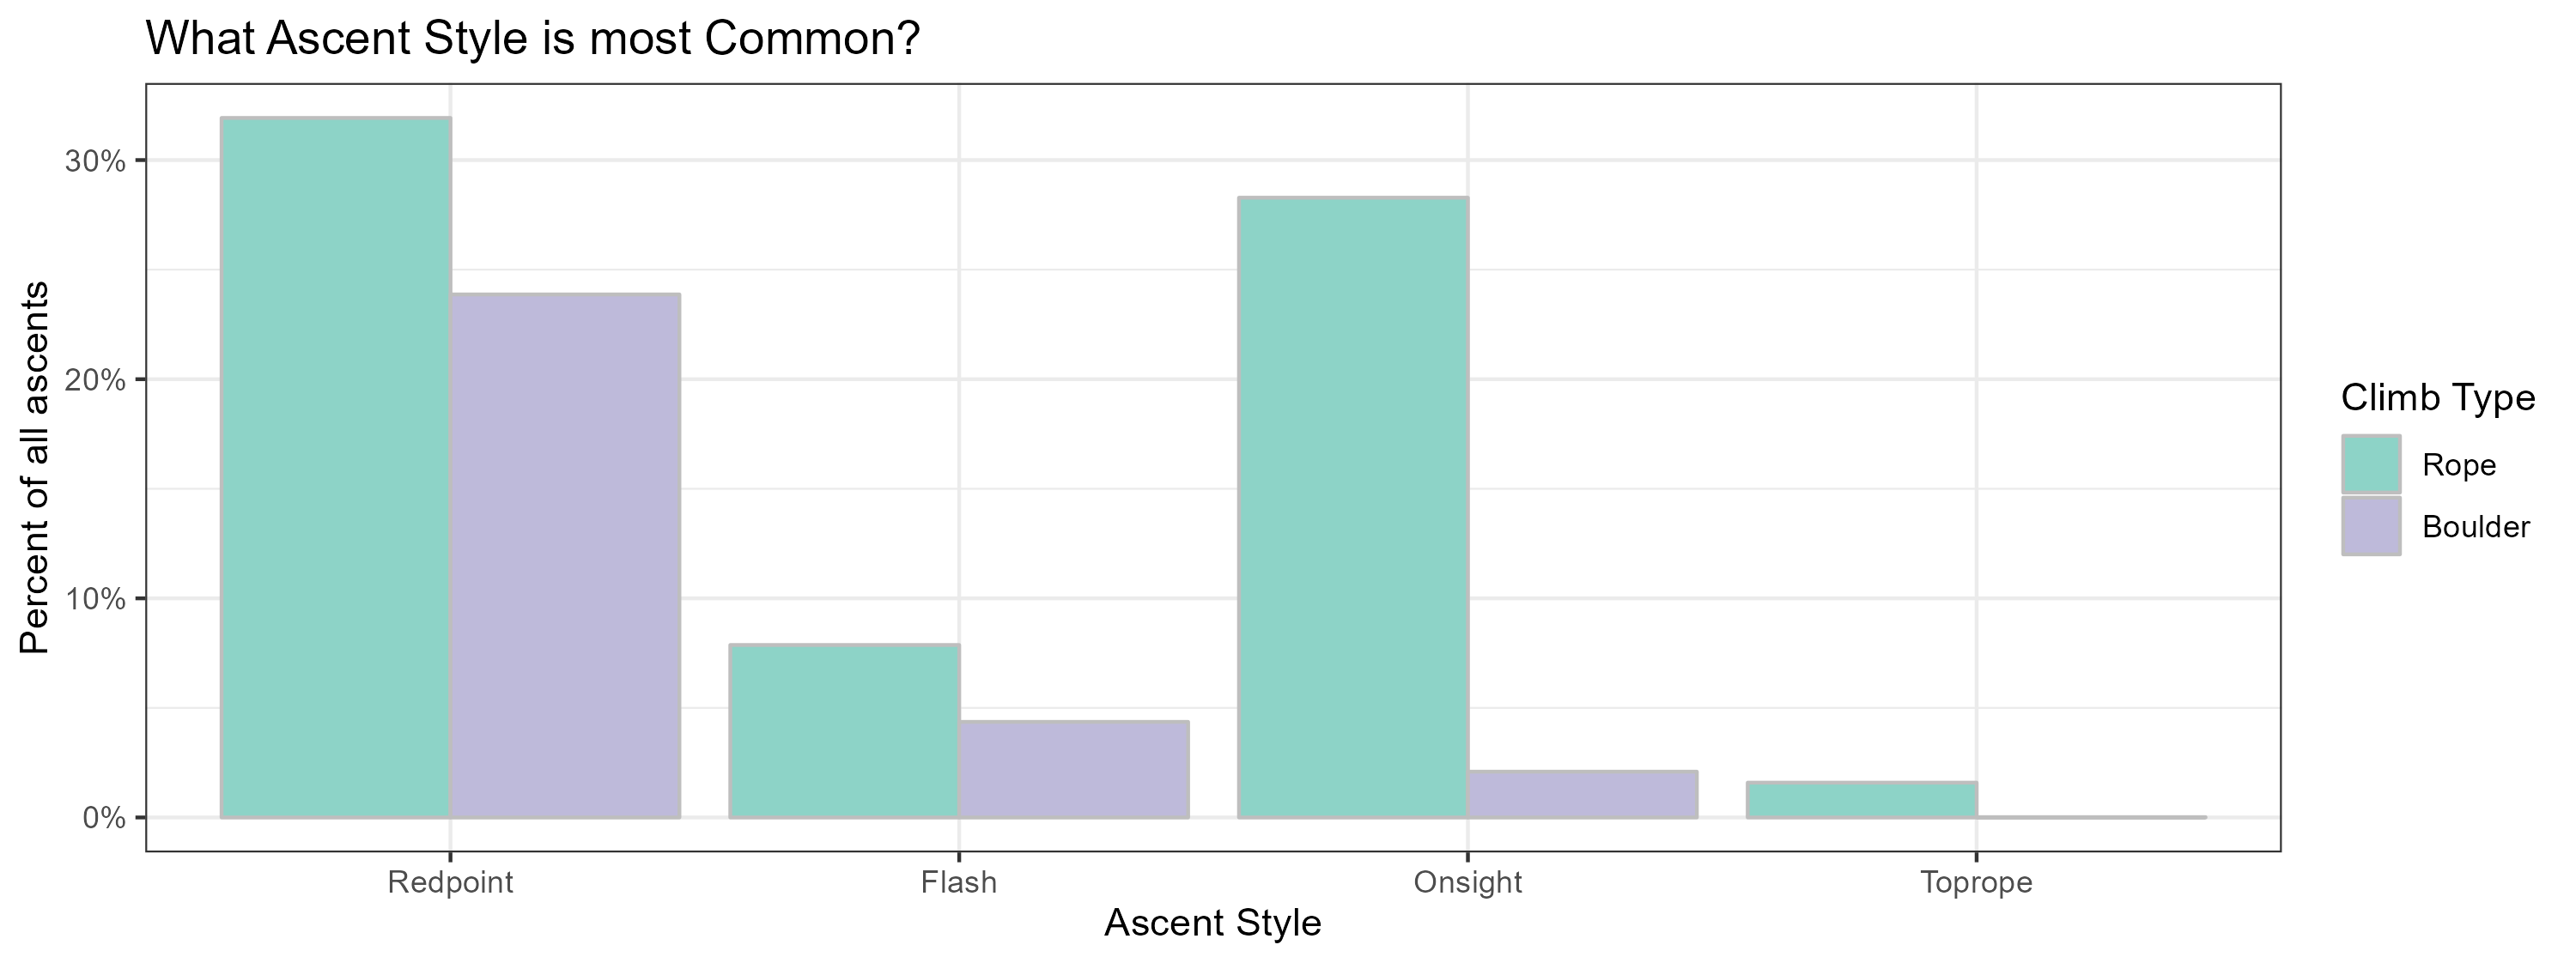
What and when do we climb?
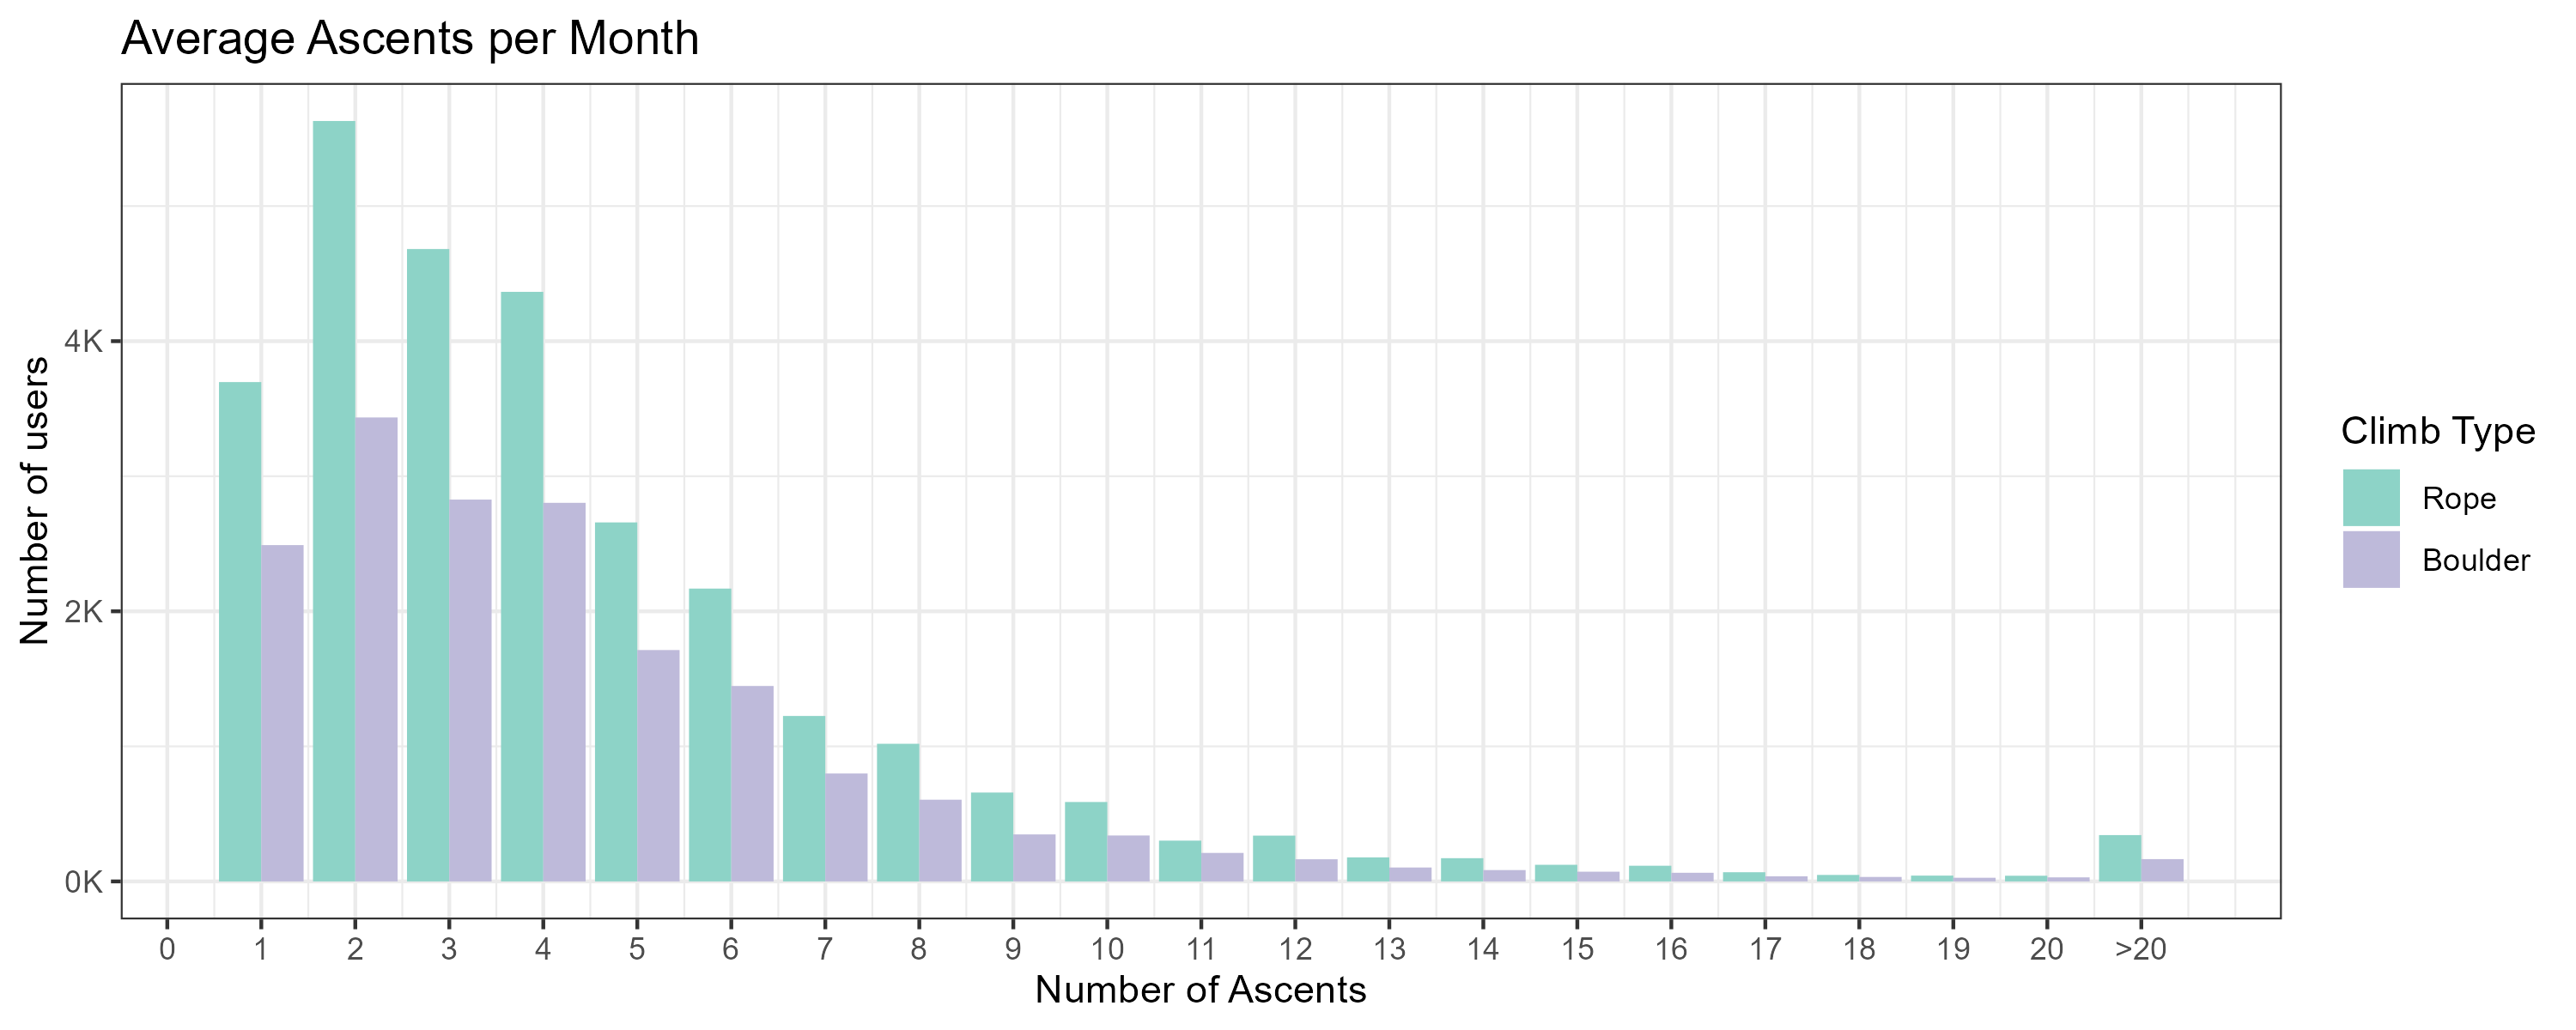
Most climbs are rope climbs, which are mostly recorded redpoint and onsight. On the contrary, it is pretty uncommon to onsight (and, of course, toprope) a boulder.
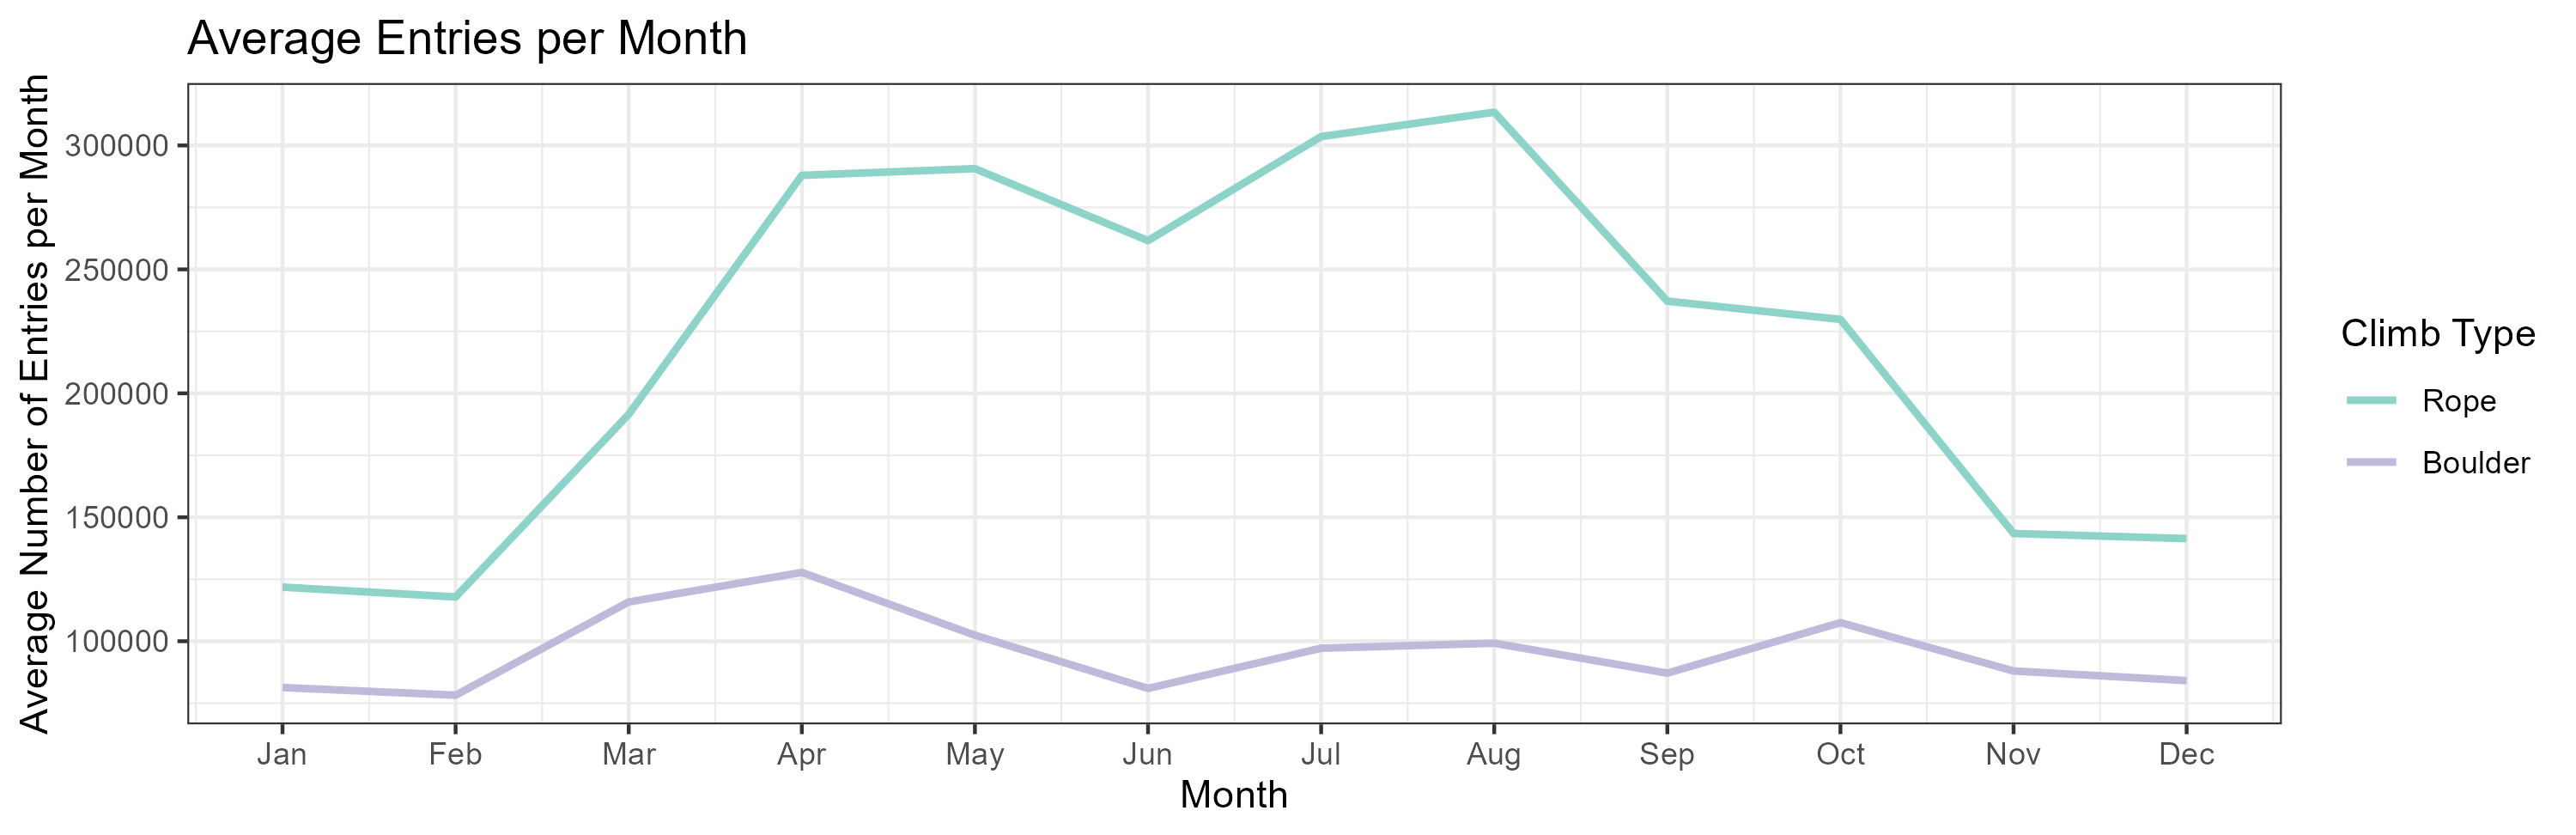
On average, summer months are more popular than winter, with sending-season ranging from April to around October. As boulderers in particular profit from colder temperatures, boulder ascents peak in April, whereas rope climbing ascents are highest in August.
And how active are members? Most members log on average two ascents per month. However the range is large, given the most motivated member logs 280 ascents per month.
Don’t we like the + grades?
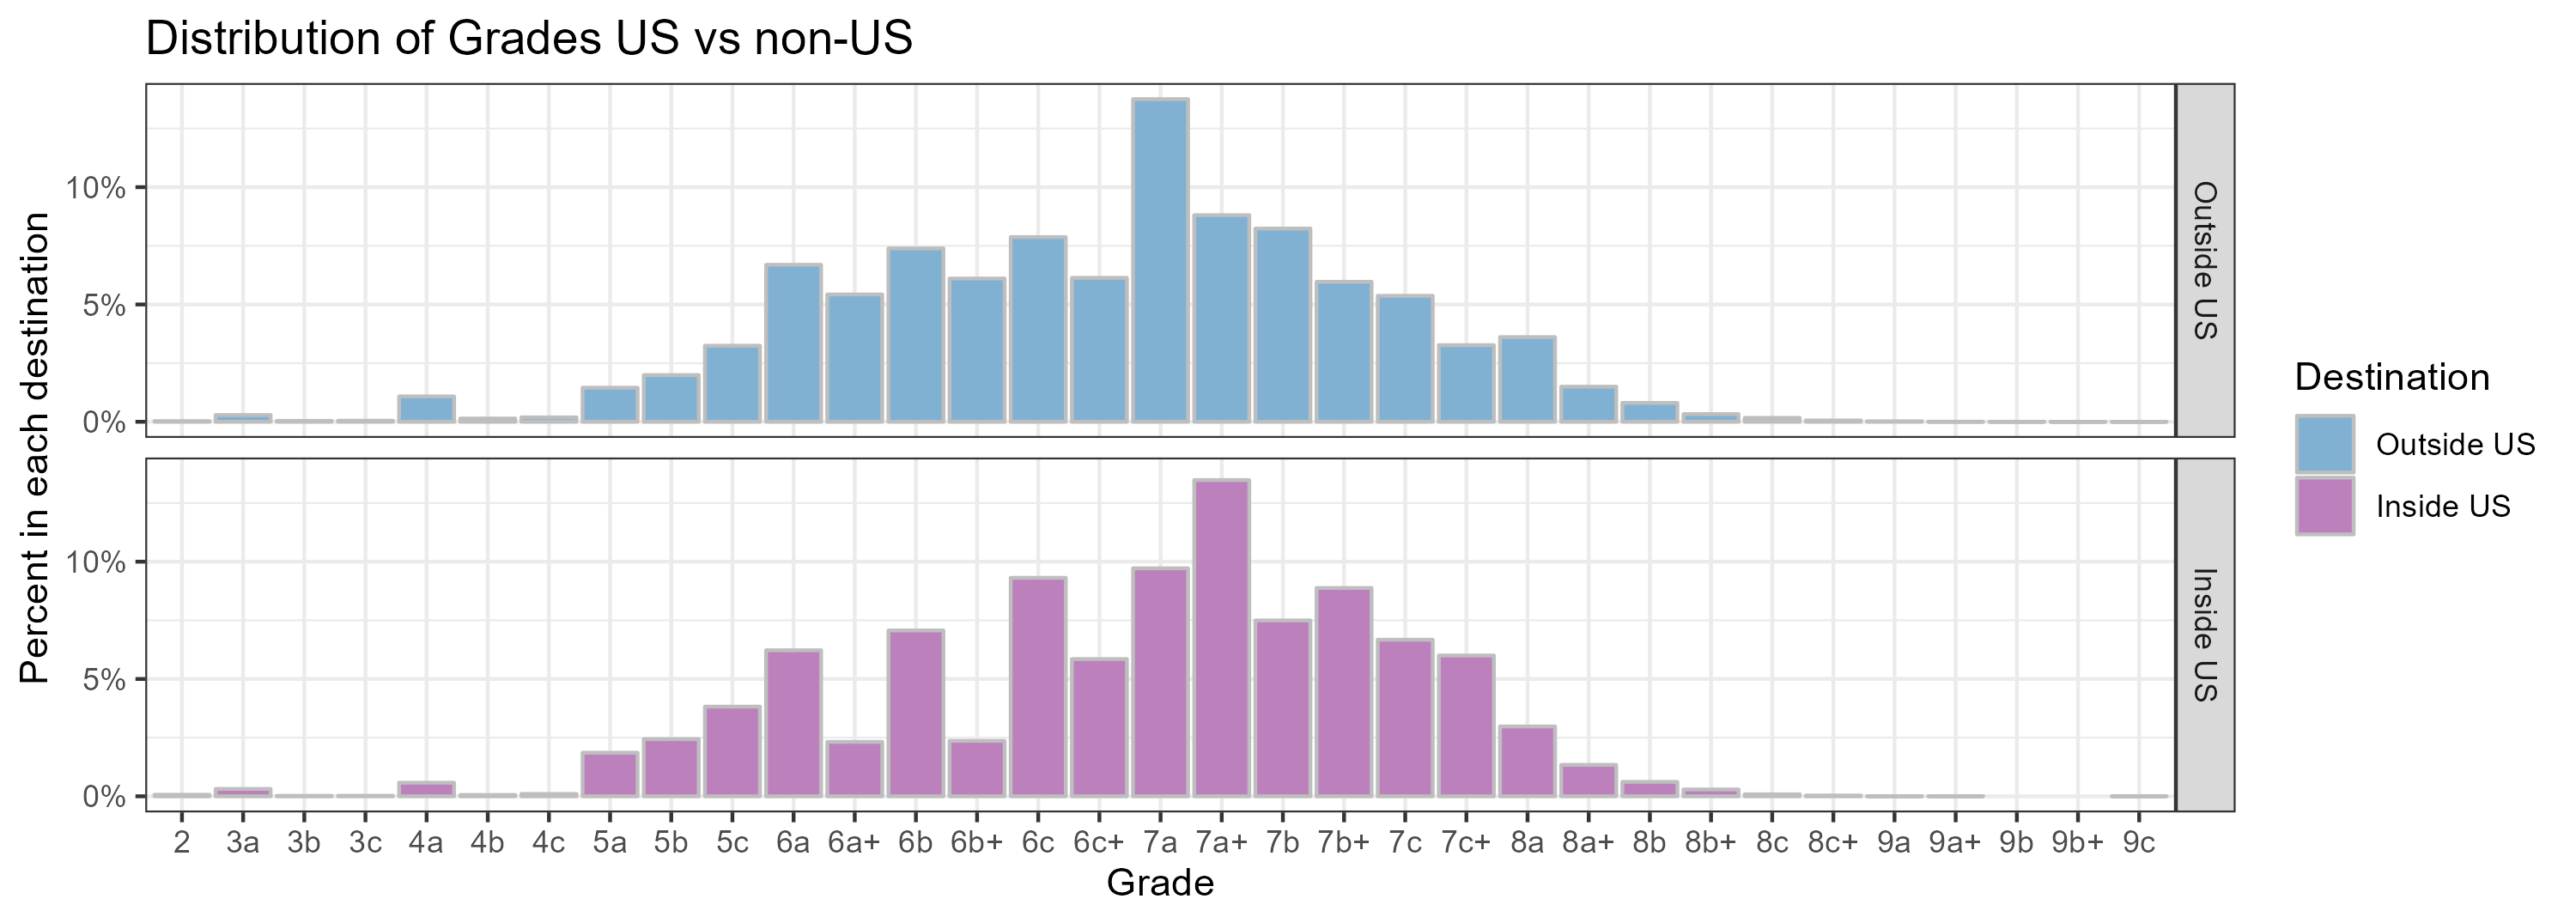
Below we show how often each grade is ticked in rope climbing. Starting to look outside the US, the most frequently ticked grade is 7a. Moreover, the “+” grades are climbed less often than the “non-+” grades. So either there are just fewer of the “+” climbs, or pschologically, it just sounds less like an achievement to add a “+” to the grade.
To further investigate the hypothesis of a kind of “psychological-anti-+-grade-bias”, the frequency of each grade is compared against only US-data, where the Yosemite Decimal System (YDS) is more common than the French grades. The YDS rates climbs on a number-lettering system using the letter subscripts a-d. Interestingly enough, in the US the French 7a+ is the most frequently ticket rope climb, which in the YDS is a 5.12a - hence marking the ‘big jump’ from 5.11d to 5.12a.
We can not entirely rule out the possibility that there might just be fewer routes with “+” or “d” subscripts - or maybe we just do not like what sounds like a half-grade-up. 😊
When you can do 7c+, you’ll try to go for 8a 💪
Regarding the hardest grade a climber has done, for men the most common hardest grade recorded is 8a, and for women it is 7a, though 8a is the second most common. Again, we see that the “+” grades are slightly less common. Particularly the jump from the number of people who climb 6c+ to 7a, and 7c+ to 8a is quite big - so a new grade number might be a motivation.
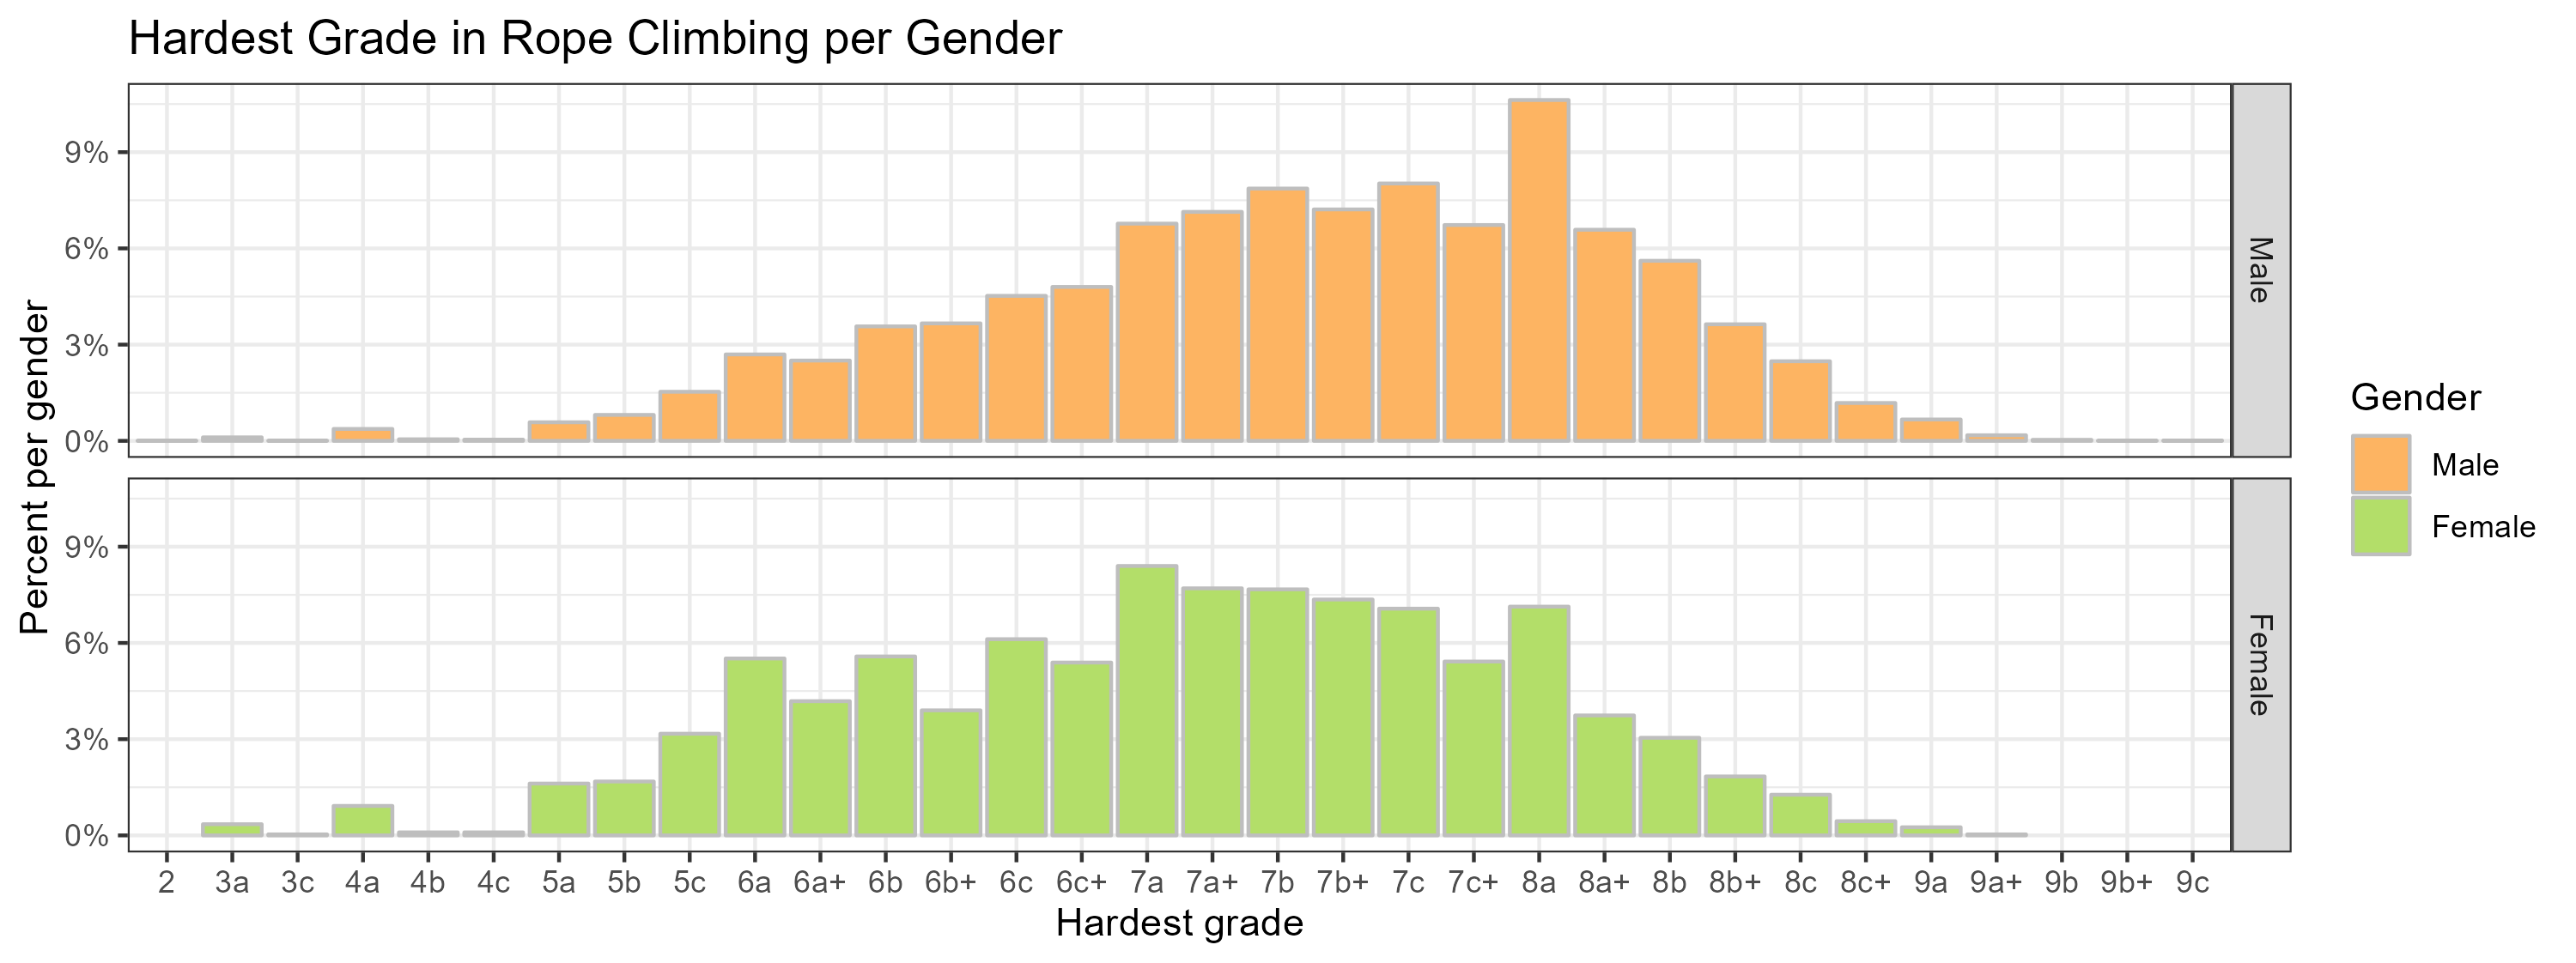
Comparing men and women, we see that men climb on average slightly higher grades. However, as highlighted in a 2021 research paper[8] the gender performance gap in rock climbing is relatively small compared to other sports. Measuring climbing ability with the hardest grade ever climbed places 3 females in the top 90 climbers of all time. Comparatively, in 100-m dash no female athlete is amongst the top 2,000 competitors (measuring ability with time taken for the 100-m run).
How long does it take to reach a new grade?
On average, 8a.nu climbers take over a year to reach a new grade
The average time to reach a new grade is 14.59 month.[9] Only looking at the mean however does not take into account that climbing progression seems to be convex: The harder the grade, the longer it takes to level-up. For example, the jump from 6a to 6a+ takes on average 3 months, 7a to 7a+ 5 months, 8a to 8a+ takes 10 months on average, and 9a to 9a+ 40 months.
Also, only looking at the mean does not tell the whole story. As the figure below shows, for the grades below the 8s climbing progression is negatively skewed. This tells us amongst others two things: The mode is smaller than the mean, and the distributions left tail is thicker than the right. In other words, while most people take less time than average to reach a new grade, there are more people that take much longer, than people that are much faster.
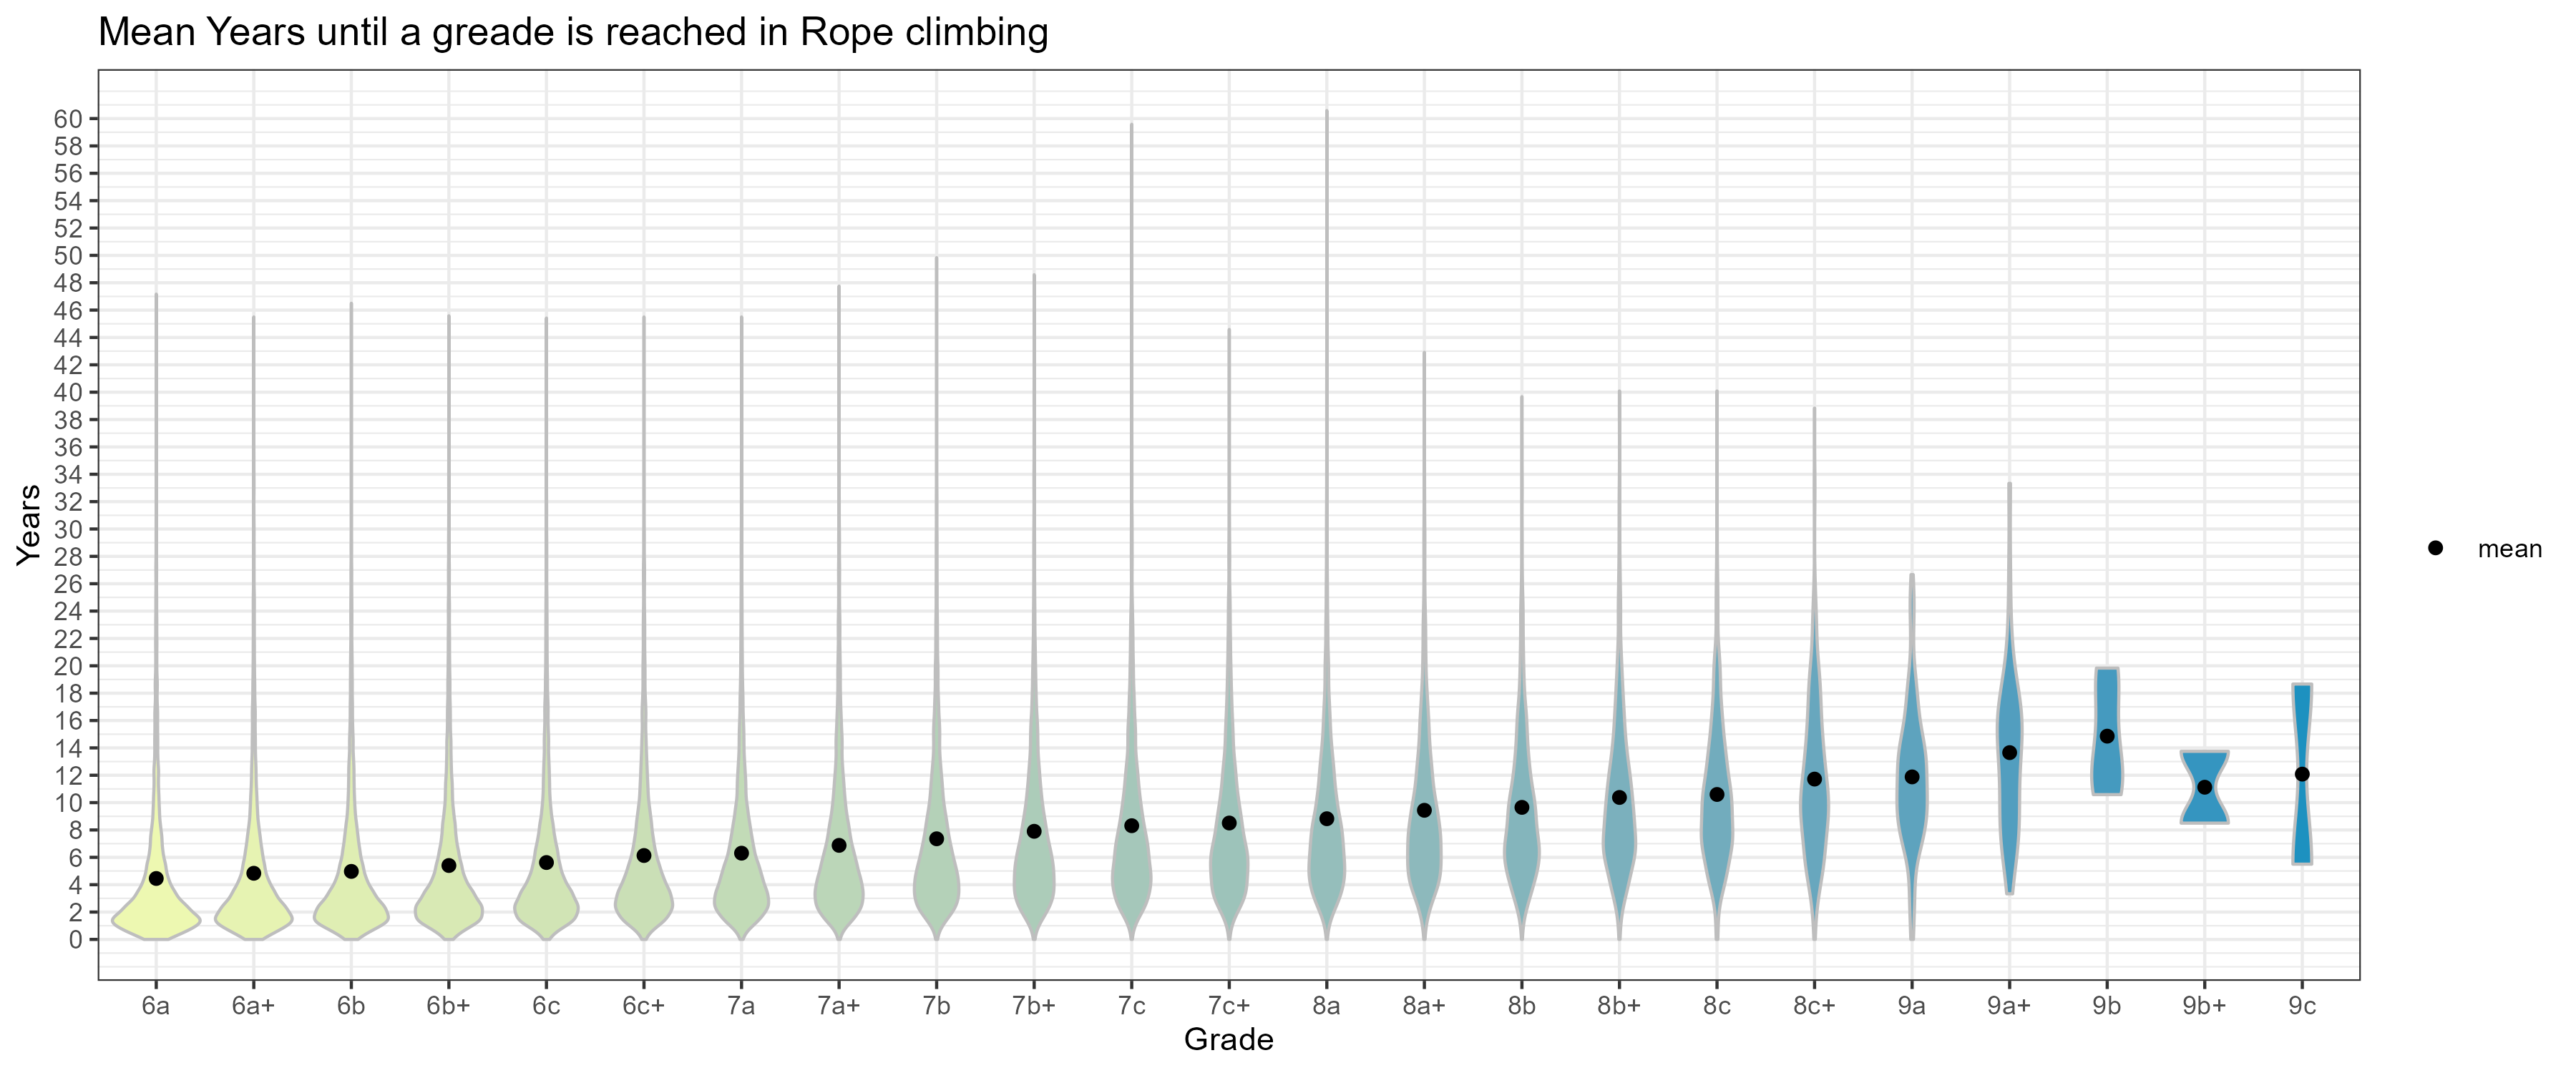
One note of caution on the interpretation of this graph: The message should not be “On average, each climber climbs 8a after 10 years.” But rather we can say something like “Climbers who log their ascents online and reach 8a at all, on average report doing this after 10 years.” Hence, some climbers are unseen in our dataset because they have no online trace of their ascents and some climber just never reach a particular grade, thus falling out of the average calculation.
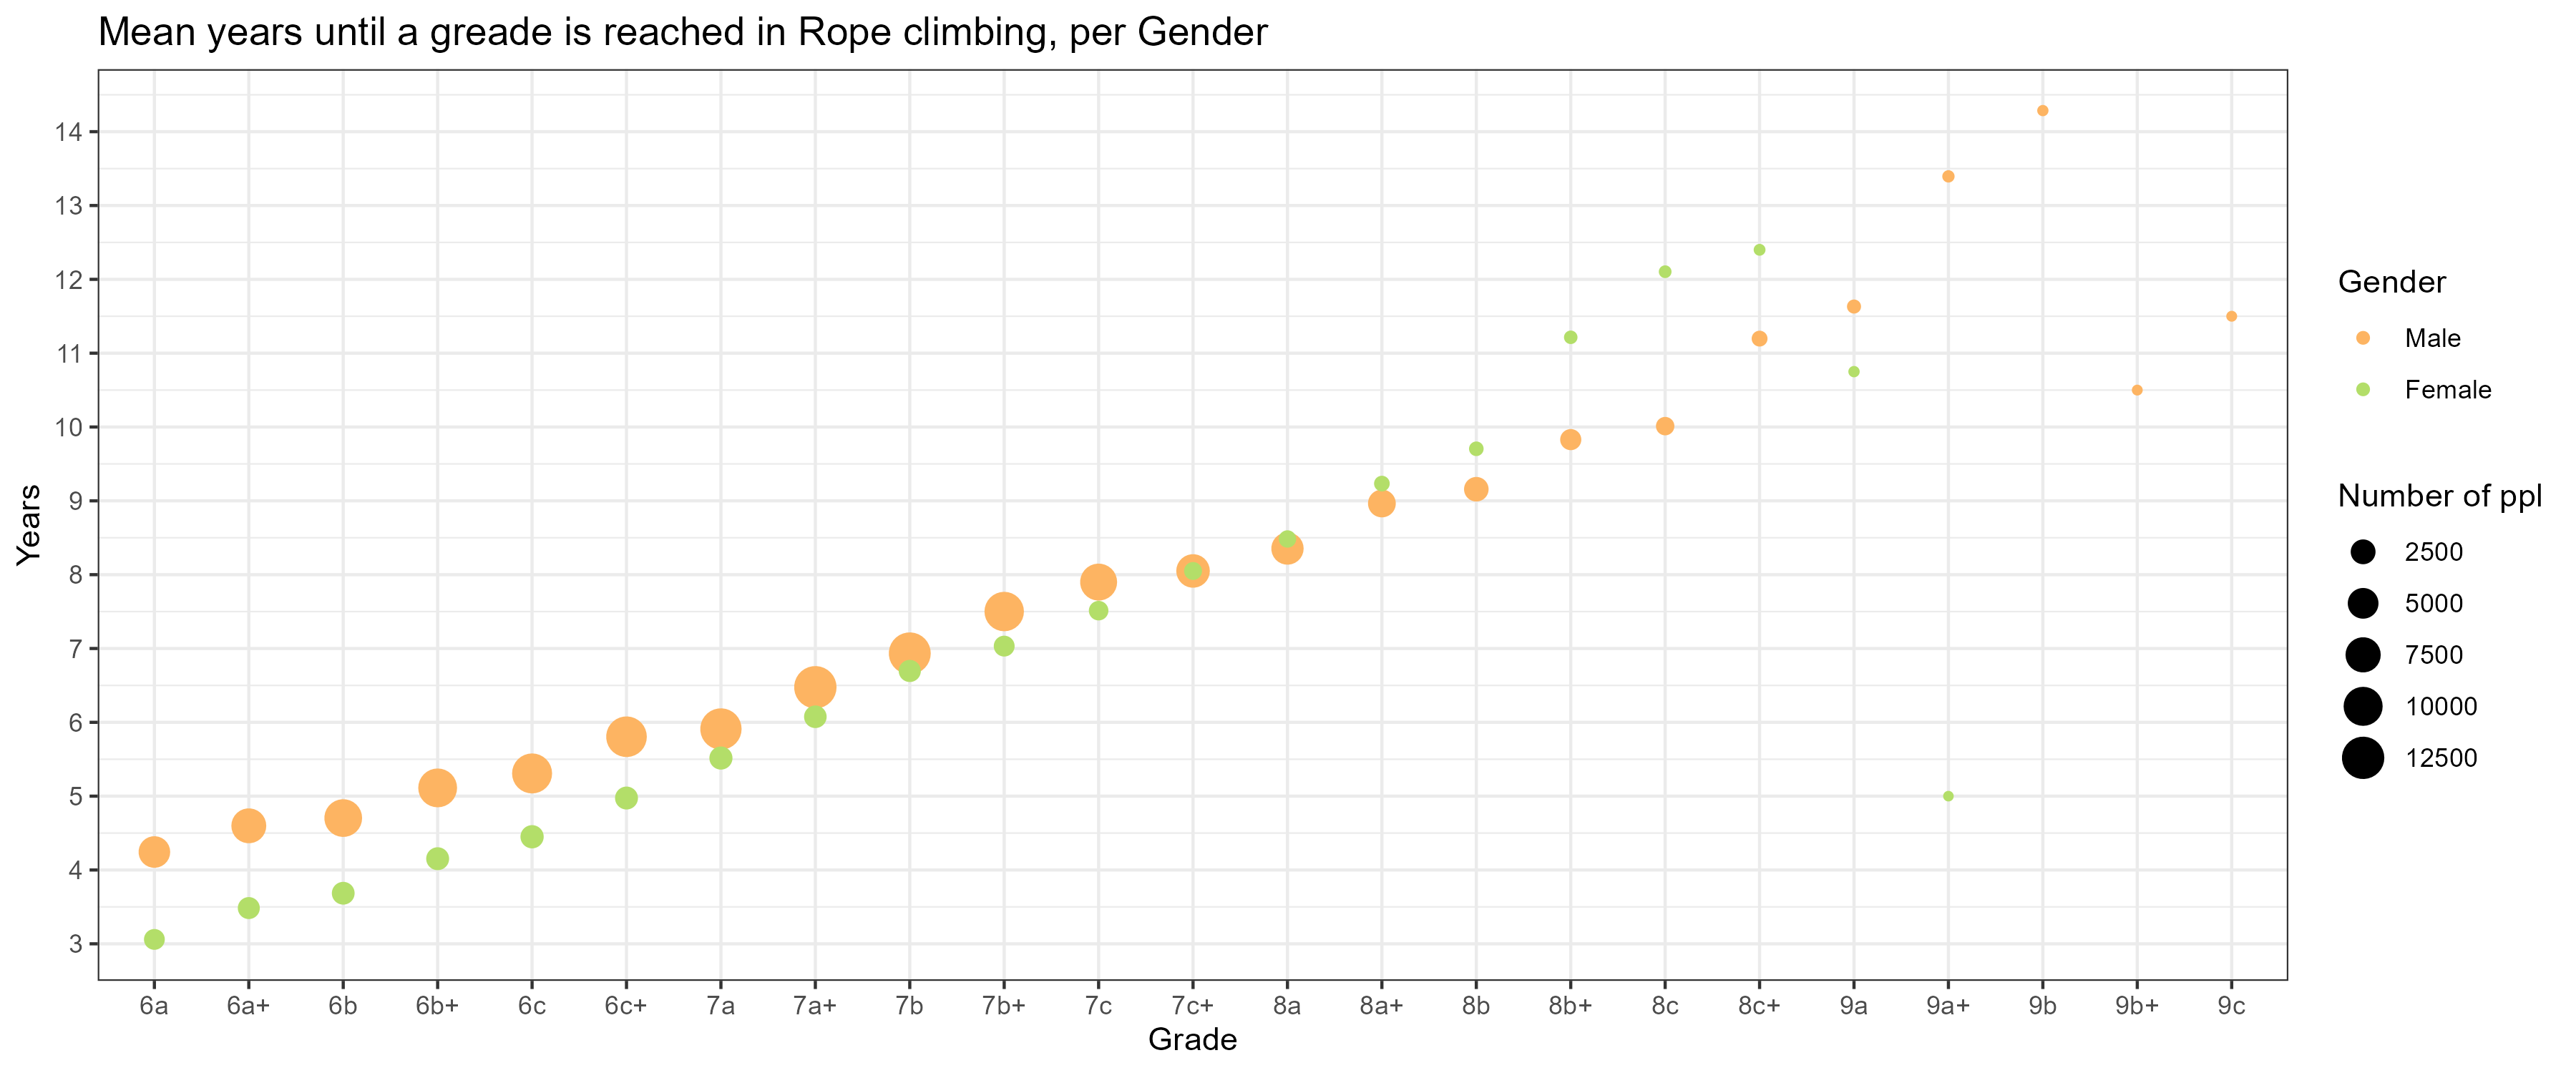
At first women are faster on average, but men catch up on the harder grades
If we look at grade progression per gender, we see that in the lower grades women on average reach a grade faster. This reverts around 8a, where men start becoming faster on average. However, we must not forget here that the sample of females is much smaller than the sample of men.
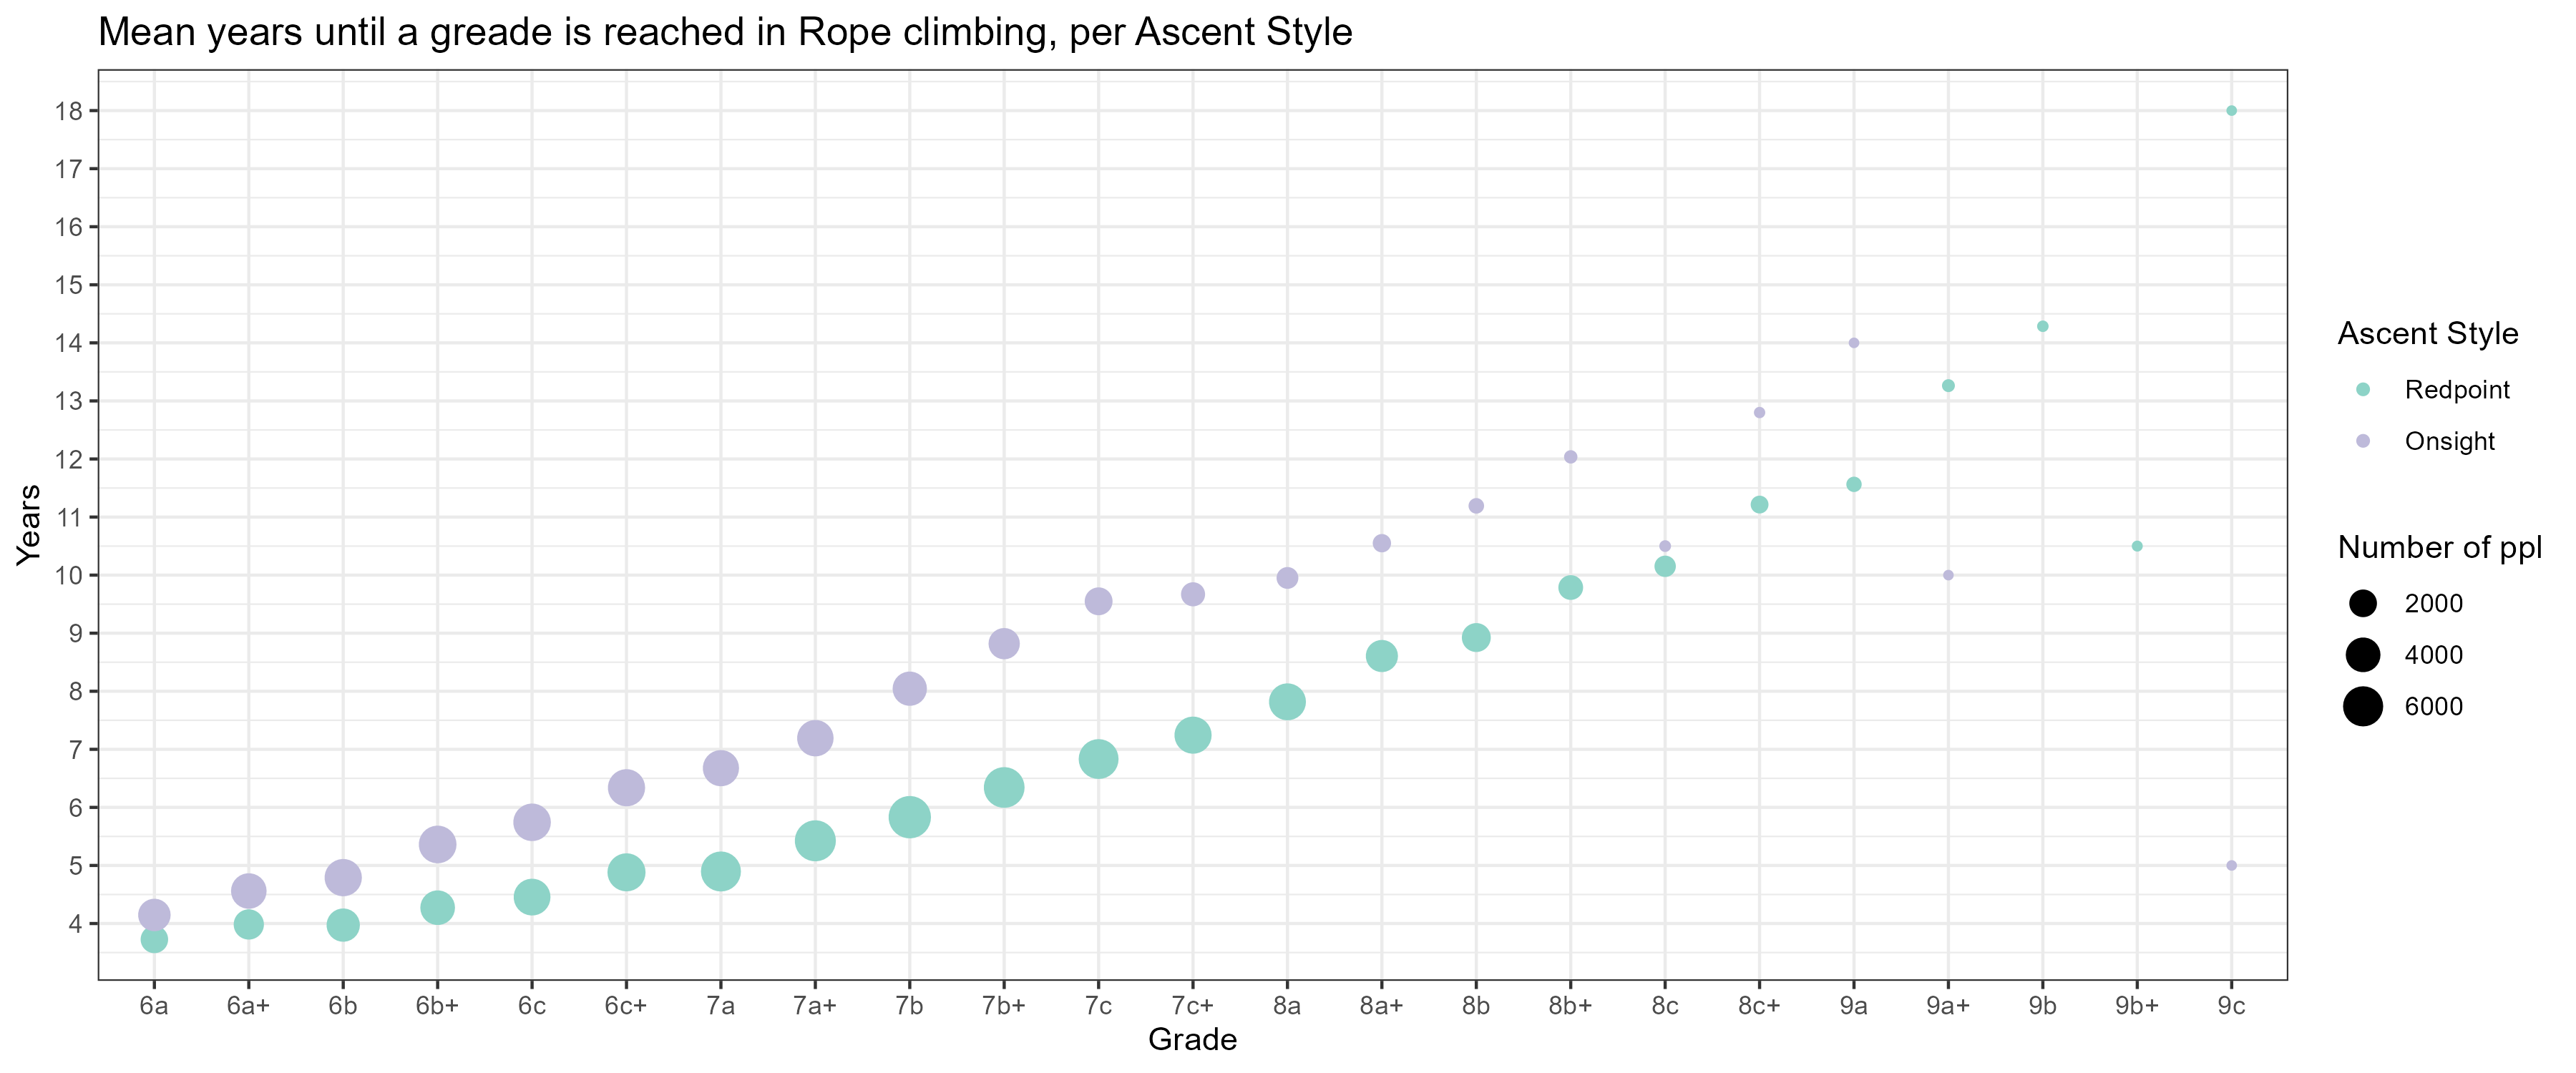
The harder the grade, the wider the gap between redpoint and onsight
Coparing the different ascent styles, of course grades are on average reached in redpoint before onsight. This gap widens the harder the grade. So on average, a person that onsights 6a could redpoint 6b, but a climber that onsights 7a might redpoint 7c.
Where do climbers send fastest?
By looking at how long climbers take to reach a new grade we can try to have a look on whether there is a country where climbs are softer, or climbers are stronger. Below 8b, on average new grades in Poland, Brazil, and the US are reached faster than average. Countries that have a slower than averge grade progression are Great Britain and Germany, though this diminishes around 7b.
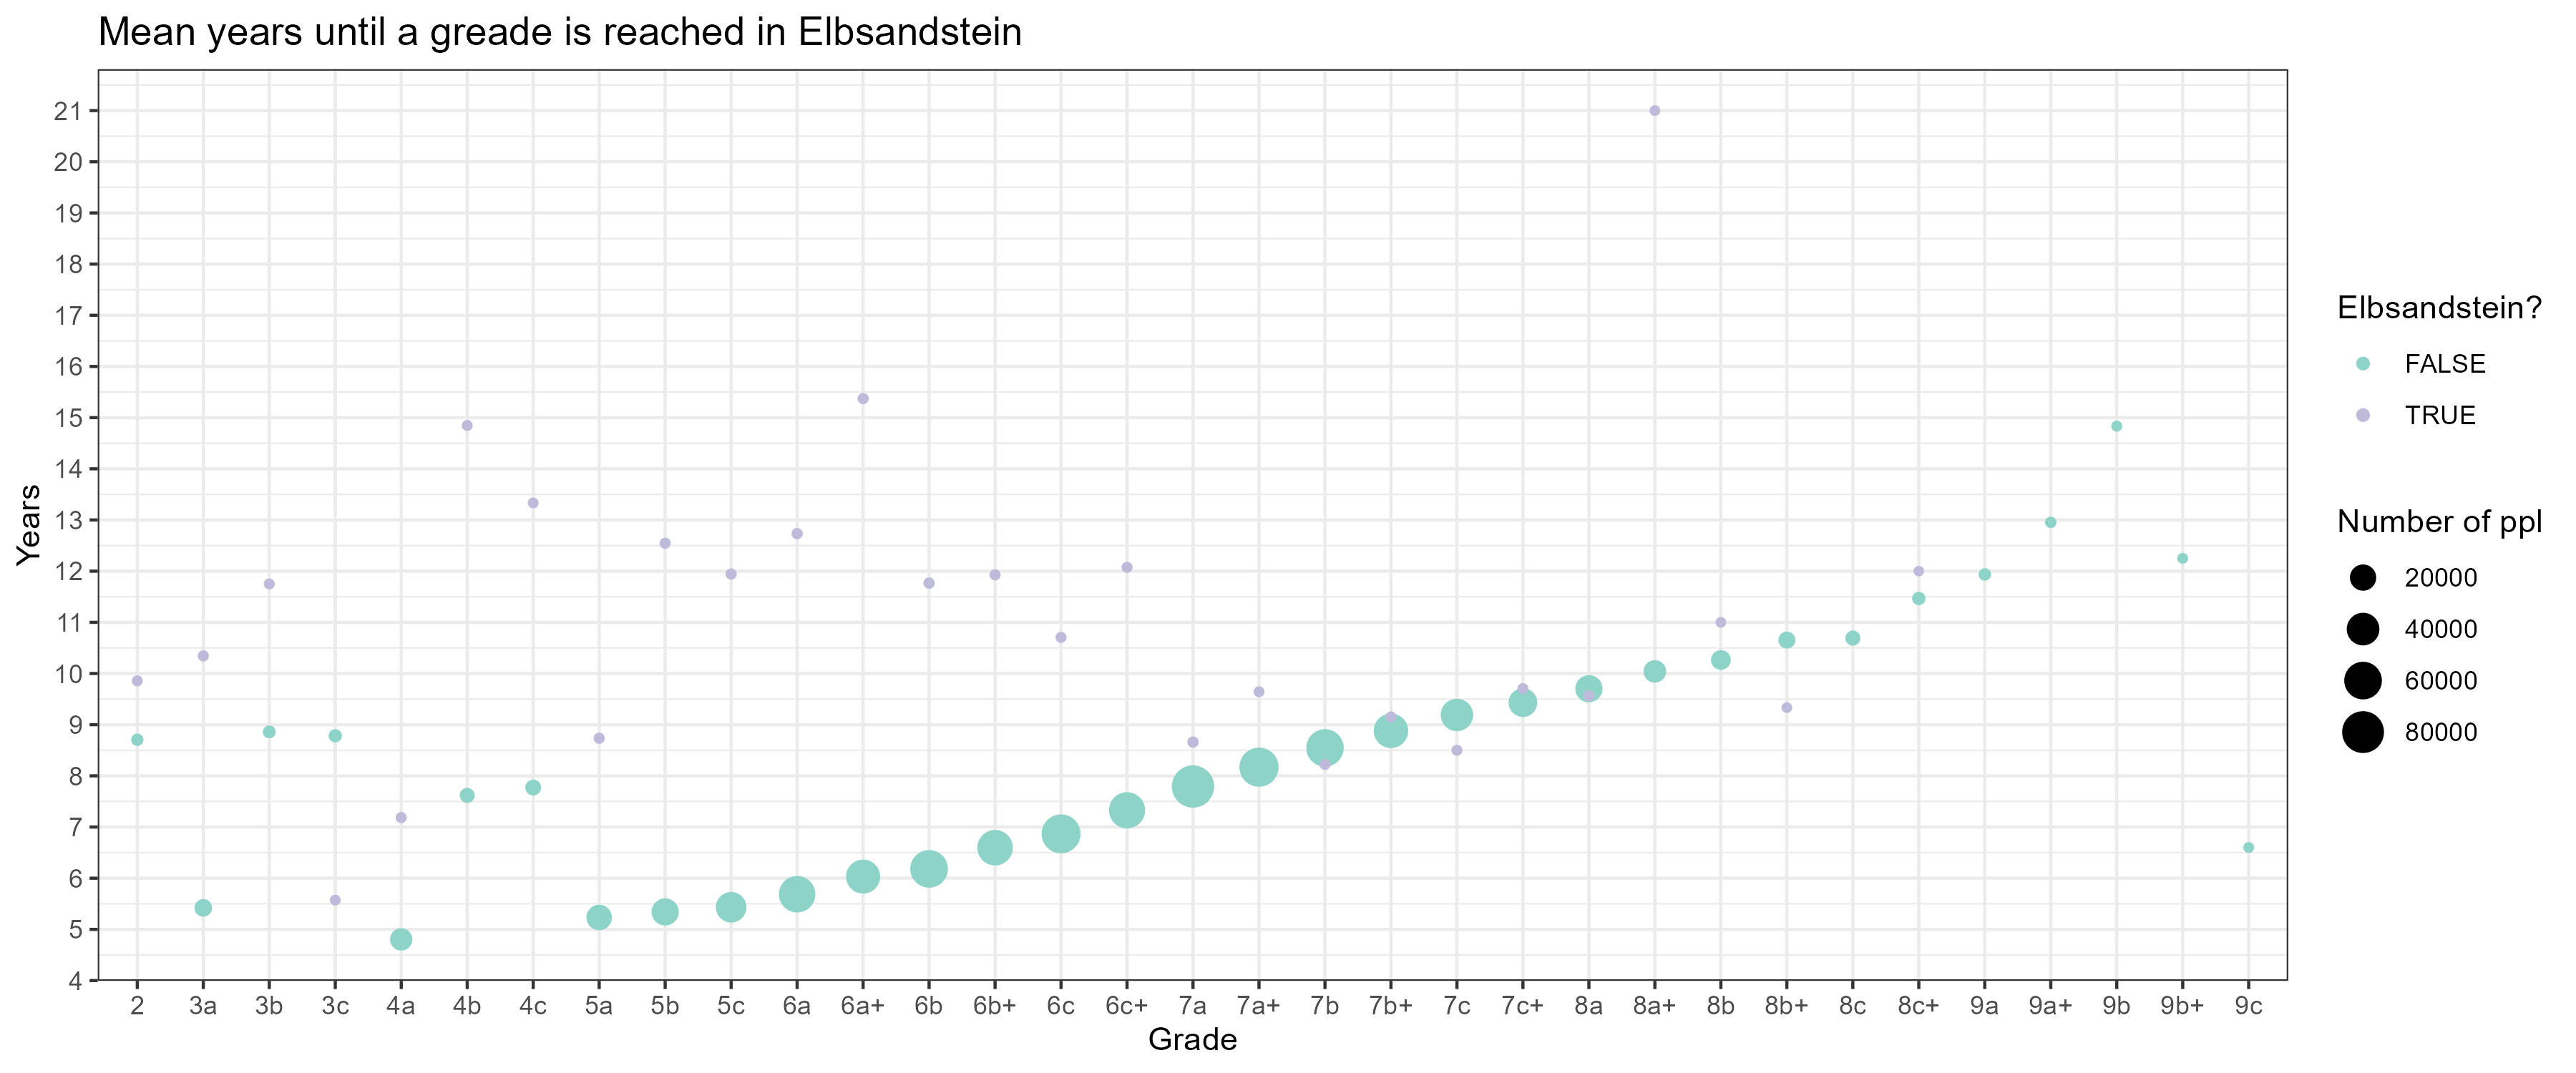
When I showed the grade progression plot to my friends climbing in the Elbstandstein in western Czech Republic and eastern Germany, they immediately pointed out, that this would never be true in this very special soft sandstone. Climbing in this area is mostly free climbing of free-standing sandstone towers, following stout ethics, including no or sparse metal protection and no use of chalk. Also, due to its pecularity the area has its own grading system.[10] As the below figure shows, fewer harder grades are climbed in Elbsandstein than on average, and the time to reach the easier grades is much slower than in other countries. So this is one example to illustrate that while grading climbs is very helpful, a grade can mean very different things in different places.
Can we predict the hardest grade?
A linear regression model of each climbers hardest grade can help to gain information which characteristics help boost climbing performance. The model uses the variables available that could predict how hard one might climb: gender, height, weight, BMI, age, age squared (for non-linear effects), experience (in years) and average logs per month (to capture activity and motivation).
We find all variables estimated to be relevant for climbing performance, measured as the hardest grade climbed.[11] Approximately, on average, men climb almost 3 grades harder as women. Concerning physique, height has a positive correlation with climbing performance, whereas weight has a negative one. Also, experience and motivation increase climbing performance: More years of experience and a higher number of logs per month increase climbing performance on average. So does age, however with diminishing returns for high age.
Overall the model can explain 30% in the variation of the hardest grade. Hence, while all parameters investigated play a role for performance, there is a fair share of variation left that we can not explain with the current model. This might make sense, if we think about the model being limited to basic physique and training variables, and not capturing more detailed abilities such as finger strength or flexibility; or mental factors such as determination, or stamina. So I’d say that’s good news - we are not only a toolbox of our body parts.
| Hardest grade climbed | ||
|---|---|---|
| Predictors | Estimates | CI |
| Intercept | 33.25 \*\*\* | 28.04 – 38.46 |
| Gender (female) | -2.77 \*\*\* | -3.05 – -2.49 |
| Height (cm) | 0.08 \*\*\* | 0.05 – 0.11 |
| Weight (kg) | -0.17 \*\*\* | -0.21 – -0.13 |
| BMI | 0.16 \*\* | 0.04 – 0.27 |
| Age (years) | 0.27 \*\*\* | 0.22 – 0.32 |
| Age^2 | -0.01 \*\*\* | -0.01 – -0.01 |
| Experience (years) | 0.46 \*\*\* | 0.45 – 0.48 |
| Average logs/month | 0.06 \*\*\* | 0.05 – 0.08 |
| Observations | 12964 | |
| R2 / R2 adjusted | 0.273 / 0.273 | |
| - p<0.05 \*\* p<0.01 \*\*\* p<0.001 | ||
Continue reading
Still curious? There are a few more people wanted to know what is in the climbing data. Not claiming to be exhaustive, this includes:
- Online Logbook Data science P1 - Do longer climbs appeal to older climbers?
- Climb Though the Data with me - What’s in the 8a.nu data? Particularly interesting, that the average height decreases for very hard grades again.
- Climber Characteristic Analysis - What influences climbing ability?
A quick climbing-terminology overview
As most sports, climbing drags its vocabulary along, hence in the following an overview of the most important terms is given.
So firstly, there are different types of climbing. Amongst others,
- Rope climbing: Fixed bolts are drilled in a stone wall, where climbers clip the rope as protection from falling to the ground. A route is done when you climb it without putting weight on the rope or pulling on protection placed in the wall;
- Bouldering: Climbing without a rope, should be at a height where you can jump down without injury.
Then there are different ascent styles which describe how you get up a route.
- Onsight: Climbing the route on the first try, without much information beyond how hard it is graded. Generally considered the hardest ascent style.
- Flash: Finishing the route after watching someone else try it or getting hints about difficult parts.
- Redpoint: The route is climbed only after several attempts.
And then of course there is the difficulty of a route.
- For rope climbing 8a.nu uses the French grading system, which ranges from 1a to 9c (as of spring 2023). The higher the number, the harder the route, and a “+” route is harder than the same number without plus. For an overview of the different grades, see e.g. here.
- 8a.nu boulders are graded on the FB grade, which works in a similar way (ranges from 1 to 8c+, uses a,b,c and +), but the grades are not equivalent to the rope climbing grades (🤯).
So, comparing rope climbing grades amongst each other can be quite hard (different rock, quality of protection etc), and comparing rope climbing and bouldering is even harder! So, let’s just keep in mind that if a climb is graded higher your best estimate should be to say it is harder, but it is really just - an estimate. Jump back to the top.
[2] Statista. (20120). Distribution of climbers and boulderers worldwide as of 2020, by gender. Retrieved from: https://www.statista.com/statistics/1311405/distribution-climbers-boulderers-gender
[3] Dwyer. (2019). Social Climbing Has a Whole New Meaning. The New York Times. Retrieved from: https://www.nytimes.com/2019/11/14/style/bouldering.html
[4] Based on a test of given or equal proportions as in Wilson (1927), the null hypothesis that the share of men in the 8a.nu community is smaller or equal to 0.75% can be rejected at the 95% confidence level. Also, this assumes that the share of men climbing was 75% in 2017. Wilson, E.B. (1927). Probable inference, the law of succession, and statistical inference. Journal of the American Statistical Association, 22, 209–212. 10.2307/2276774.
[5] Hannah Ritchie and Max Roser. (2017). Obesity. Published online at OurWorldInData.org. Retrieved from: https://ourworldindata.org/obesity
[6] Based on a one-sample student t-test as in Student (1908), the null hypothesis that the climbers BMI is higher or equal than the worldwide average for each gender can be rejected at the 95% confidence level for both men and women. Student. (1908). The probable error of a mean. Biometrika, 6(1), 1-25.
[7] World Health Organization. (2010). A healthy lifestyle - WHO recommendations. Retrieved from: https://www.euro.who.int/en/health-topics/disease-prevention/nutrition/a-healthy-lifestyle/body-mass-index-bmi
[8] Collin Carroll, Female excellence in rock climbing likely has an evolutionary origin, Current Research in Physiology, Volume 4, 2021, Pages 39-46, ISSN 2665-9441. doi: https://doi.org/10.1016/j.crphys.2021.01.004,
[9] The mean time to reach a new grade is calculated for all grades harder than 6a, since the data on the lower grades is sparse.
[10] More information on climbing in Elbsandstein can be found here.‚
[11] For all parameters estimated we can reject the null hypothesis of no correlation with the hardest grade at the 1% significance level.